
Page 185 - Quantitative Data Analysis
P. 185
Quantitative Data Analysis
Simply Explained Using SPSS
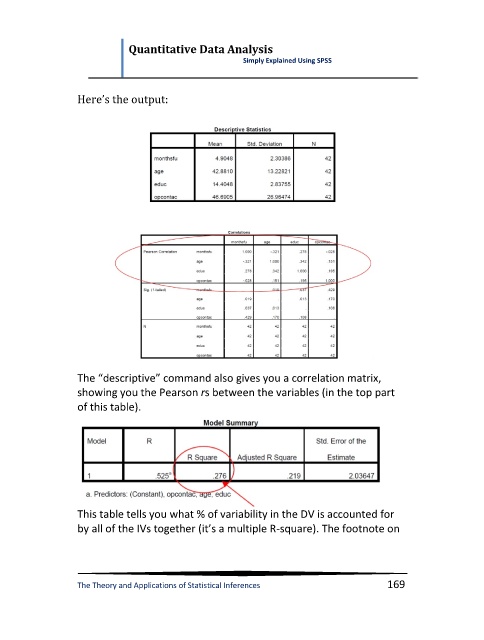
Here’s the output:
The “descriptive” command also gives you a correlation matrix,
showing you the Pearson rs between the variables (in the top part
of this table).
This table tells you what % of variability in the DV is accounted for
by all of the IVs together (it’s a multiple R-square). The footnote on
The Theory and Applications of Statistical Inferences 169