
Page 223 - Quantitative Data Analysis
P. 223
Quantitative Data Analysis
Simply Explained Using SPSS
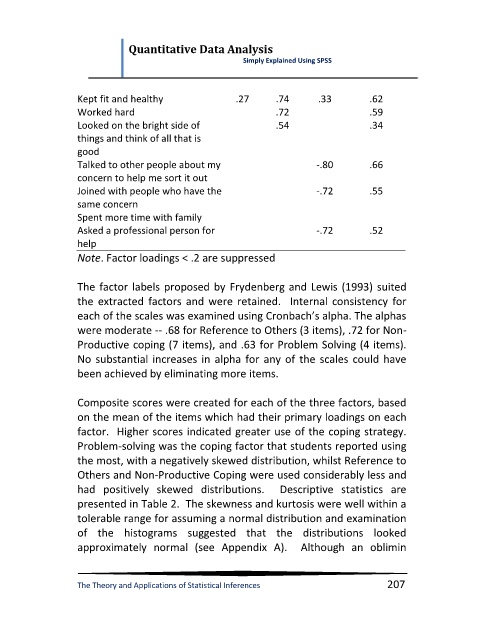
Kept fit and healthy .27 .74 .33 .62
Worked hard .72 .59
Looked on the bright side of .54 .34
things and think of all that is
good
Talked to other people about my -.80 .66
concern to help me sort it out
Joined with people who have the -.72 .55
same concern
Spent more time with family
Asked a professional person for -.72 .52
help
Note. Factor loadings < .2 are suppressed
The factor labels proposed by Frydenberg and Lewis (1993) suited
the extracted factors and were retained. Internal consistency for
each of the scales was examined using Cronbach’s alpha. The alphas
were moderate -- .68 for Reference to Others (3 items), .72 for Non-
Productive coping (7 items), and .63 for Problem Solving (4 items).
No substantial increases in alpha for any of the scales could have
been achieved by eliminating more items.
Composite scores were created for each of the three factors, based
on the mean of the items which had their primary loadings on each
factor. Higher scores indicated greater use of the coping strategy.
Problem-solving was the coping factor that students reported using
the most, with a negatively skewed distribution, whilst Reference to
Others and Non-Productive Coping were used considerably less and
had positively skewed distributions. Descriptive statistics are
presented in Table 2. The skewness and kurtosis were well within a
tolerable range for assuming a normal distribution and examination
of the histograms suggested that the distributions looked
approximately normal (see Appendix A). Although an oblimin
The Theory and Applications of Statistical Inferences 207