
Page 224 - Quantitative Data Analysis
P. 224
Quantitative Data Analysis
Simply Explained Using SPSS
rotation was used, only small correlations between each of the
composite scores existed - .17 between Problem Solving and
Reference to Others, -.07 between Problem Solving and Non-
Productive coping, and .15 between Reference to Others and Non-
Productive coping.
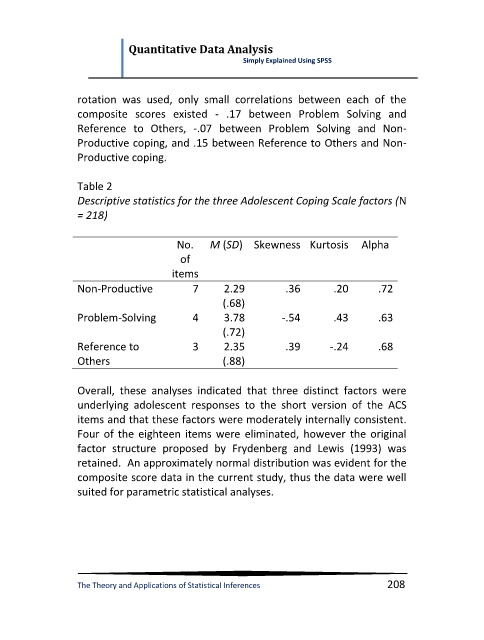
Table 2
Descriptive statistics for the three Adolescent Coping Scale factors (N
= 218)
No. M (SD) Skewness Kurtosis Alpha
of
items
Non-Productive 7 2.29 .36 .20 .72
(.68)
Problem-Solving 4 3.78 -.54 .43 .63
(.72)
Reference to 3 2.35 .39 -.24 .68
Others (.88)
Overall, these analyses indicated that three distinct factors were
underlying adolescent responses to the short version of the ACS
items and that these factors were moderately internally consistent.
Four of the eighteen items were eliminated, however the original
factor structure proposed by Frydenberg and Lewis (1993) was
retained. An approximately normal distribution was evident for the
composite score data in the current study, thus the data were well
suited for parametric statistical analyses.
The Theory and Applications of Statistical Inferences 208