
Page 269 - Data Science Algorithms in a Week
P. 269
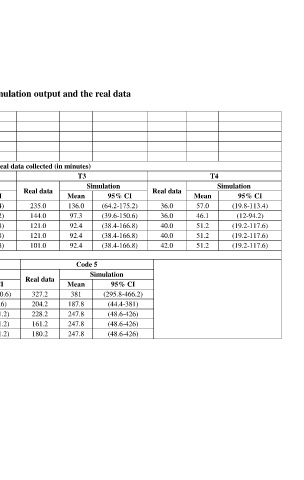
Table 10. Comparison of simulation output and the real data

 Waiting durations   Description
 T1   Time between arrival and triage
 T2   Time between triage and registration
 T3   Time from registration to available exam room
 T4   Time from first assessment to discharge
 Simulation output vs. Real data collected (in minutes)
 T1   T2          T3                            T4
 Days   Simulation   Simulation   Simulation      Simulation
 Real data   Real data   Real data   Real data
 Mean   95% CI   Mean   95% CI   Mean   95% CI   Mean   95% CI
 Mon   12.7   17.0   (4.8-46.8)   1.7   1.0   (0.42-2.4)   235.0   136.0   (64.2-175.2)   36.0   57.0   (19.8-113.4)
 Tue   6.6   5.4   (2.4-10.8)   0.6   0.5   (0.06-1.2)   144.0   97.3   (39.6-150.6)   36.0   46.1   (12-94.2)
 Wed   10.0   4.9   (1.8-9.6)   1.8   0.6   (0.12-1.8)   121.0   92.4   (38.4-166.8)   40.0   51.2   (19.2-117.6)
 Thu   10.0   4.9   (1.8-9.6)   1.8   0.6   (0.12-1.8)   121.0   92.4   (38.4-166.8)   40.0   51.2   (19.2-117.6)
 Fri   17.9   4.9   (1.8-9.6)   2.2   0.6   (0.12-1.8)   101.0   92.4   (38.4-166.8)   42.0   51.2   (19.2-117.6)

 Code 3   Code 4   Code 5
 Days   Simulation   Simulation   Simulation
 Real data   Real data   Real data
 Mean   95% CI   Mean   95% CI   Mean   95% CI
 Mon   89.6   91.2   (72.6-113.4)   257.9   277.9   (194.4-360.6)   327.2   381   (295.8-466.2)
 Tue   68.1   89.6   (67.2-115.8)   172.9   189.9   (90-321.6)   204.2   187.8   (44.4-381)
 Wed   72.1   84.3   (64.8-105)   201.9   180.5   (86.4-301.2)   228.2   247.8   (48.6-426)
 Thu   54.7   84.3   (64.8-105)   144.9   180.5   (86.4-301.2)   161.2   247.8   (48.6-426)
 Fri   87.2   84.3   (64.8-105)   163.9   180.5   (86.4-301.2)   180.2   247.8   (48.6-426)