
Page 331 - Data Science Algorithms in a Week
P. 331
312 Mayra Bornacelli, Edgar Gutierrez and John Pastrana
S = ∑ N ASE( without x ) − ASE(x ) (2)
β
β
β
j=1
Moody and Utans (1994) explains very well this process as follows “Here, is the
βth input variable of the jth exemplar. Sβ measures the effect on the average training
̅
̅
̅
̅
squared error (ASE) of replacing the βth input xβ by its average . Replacement of a
variable by its average value removes its influence on the network output.” Again we use
CV to estimate the prediction risk CV . A sequence of models by deleting an
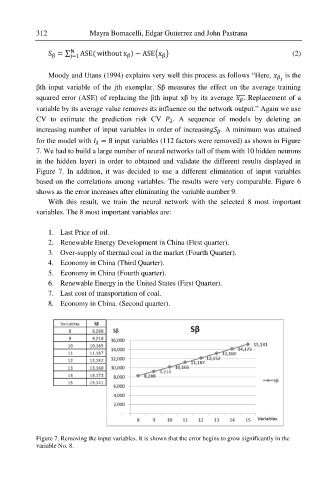
increasing number of input variables in order of increasing . A minimum was attained
for the model with = 8 input variables (112 factors were removed) as shown in Figure
7. We had to build a large number of neural networks (all of them with 10 hidden neurons
in the hidden layer) in order to obtained and validate the different results displayed in
Figure 7. In addition, it was decided to use a different elimination of input variables
based on the correlations among variables. The results were very comparable. Figure 6
shows as the error increases after eliminating the variable number 9.
With this result, we train the neural network with the selected 8 most important
variables. The 8 most important variables are:
1. Last Price of oil.
2. Renewable Energy Development in China (First quarter).
3. Over-supply of thermal coal in the market (Fourth Quarter).
4. Economy in China (Third Quarter).
5. Economy in China (Fourth quarter).
6. Renewable Energy in the United States (First Quarter).
7. Last cost of transportation of coal.
8. Economy in China. (Second quarter).
Figure 7. Removing the input variables. It is shown that the error begins to grow significantly in the
variable No. 8.