
Page 3 - Vibrations 6
P. 3
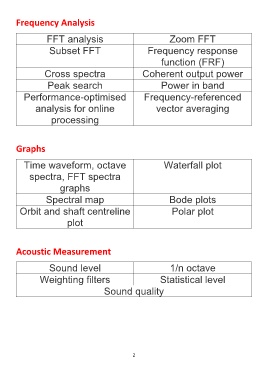
Frequency Analysis


                      FFT analysis                                          Zoom FFT

                       Subset FFT                                  Frequency response

                                                                         function (FRF)

                     Cross spectra                              Coherent output power

                      Peak search                                        Power in band

            Performance-optimised                                Frequency-referenced

                 analysis for online                                  vector averaging


                        processing


        Graphs


            Time waveform, octave                                         Waterfall plot

              spectra, FFT spectra


                            graphs

                     Spectral map                                           Bode plots

          Orbit and shaft centreline                                         Polar plot

                               plot


        Acoustic Measurement


                       Sound level                                           1/n octave

                   Weighting filters                                    Statistical level


                                               Sound quality


                                                            2