
Page 31 - Shock and Vibration Overview
P. 31
Analysis Overview
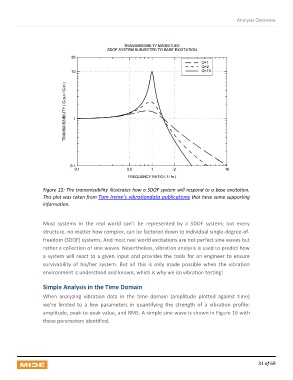
Figure 15: The transmissibility illustrates how a SDOF system will respond to a base excitation.
This plot was taken from Tom Irvine’s vibrationdata publications that have some supporting
information.
Most systems in the real world can’t be represented by a SDOF system; but every
structure, no matter how complex, can be factored down to individual single-degree-of-
freedom (SDOF) systems. And most real world excitations are not perfect sine waves but
rather a collection of sine waves. Nevertheless, vibration analysis is used to predict how
a system will react to a given input and provides the tools for an engineer to ensure
survivability of his/her system. But all this is only made possible when the vibration
environment is understood and known, which is why we do vibration testing!
Simple Analysis in the Time Domain
When analyzing vibration data in the time domain (amplitude plotted against time)
we’re limited to a few parameters in quantifying the strength of a vibration profile:
amplitude, peak-to-peak value, and RMS. A simple sine wave is shown in Figure 16 with
these parameters identified.
31 of 69