
Page 540 - B2B all year round_UPDATE 5
P. 540
15년 하반기 LGE CHI향 ISSUE 관련
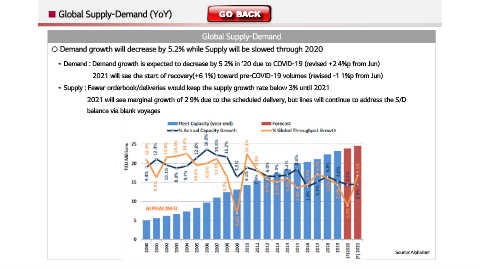
■ Market Trend
Post COVID-19 – Changes in S/D balance and Rate Dynamics
Unit : TEU
<Correlation between LB import volume and capacity>
350,000 100,000
Demand Supply Index
Year Month
(Wkly avg) (avg) (Jan=1.0) 90,000
’20 Jan 77,490 271,921 1.00 300,000 Jan=1.0
80,000
’20 Feb 62,148 174,052 1.25
’20 Mar 58,643 263,094 0.78 250,000 70,000
’20 Apr 63,385 221,970 1.00
60,000
’20 May 78,148 234,242 1.17 200,000
’20 Jun 75,179 254,372 1.04 Exceed demand compared to Jan 50,000
Demand
Supply
Wkly Capa (avg.) LBG I/B
’20 Jul 94,202 305,922 1.08 (avg. / Left Axis) (Right
150,000 Axis) 40,000
’20 Aug 94,202(e) 324,400 1.02 Jan Feb Mar Apr May Jun Jul Aug Sep
Market Rate
‘20 Sep 94,202(e) 316,534 1.04 (USWC, per $1,554 $1,417 $1,509 $1,608 $1,798 $2,562 $2,874 $3,373 $4,000(e)
FEU)
* Assuming LGB import volume in Aug. and Sep. is same as in Jul. Supply adjustment Demand increase > Supply increase
[Background for Transpacific E/B Rate rise in 2H] [Supply/Demand forecast(Short/Mid term)]
• The extra capacity injection was not sufficient enough to cover
the demand recovery
Demand accumulated since Apr. surpassed supply range Demand Supply
• Continued demand increase while US GDP decrease 31.7% in 2Q
Steady demand due to daily necessity and revenge shopping Strong demand is expected to Limited supply growth
• Carrier supply discipline with strong bond within Alliance last in the short term Continued artificial supply
Carriers are managing capacity levels in accordance with Strong demand expected adjustment by Carrier
market demand until 3Q