
Page 25 - Insurance Times November 2021
P. 25
It is necessary to mention here, the following three factors, should not be lulled into any complacency in matters relating
the relative indicators of which are assumed (for the to a mechanism so vital to a healthy and safe society.
purpose of above analyis) to have remained more or less
same during the period under consideration. References :
a. All India Motor Tariff Booklet (2002) - Tariff Advisory
1. The irresponsible attitude of owners and drivers, poor Committee.
maintenance of vehicles and roads, poor traffic b. IRDAI Circular IRDAINL / NL / NTFN / MOTP / 91 / 06 /
management, and poor traffic sense amongst other 2018 on Motor Third Party Premium Rates for the year
road users, clearly visible in every day life, might have 2019-20
definitely applied brakes on the sliding incidence rate. c. Report of Ministry of Road Transport and Highways -
Otherwise things would have been much better. Thus Road Accidents in India 2019
today's rates do have an element of charge on this d. Segmentwise Premium data published by General
count and it cannot be totally ignored.
Insurance Council.
2. Often, insurers are blamed for poor management of
their Third Party Liability claims portfolio. Expert Annexure - A
awards, poor drafting of written statements, abscence Indicators of Road Accident Incidences 1970 - 2019 - Extract
of effective control over dealing advocates, lack of co- of Annual Report of Ministry of Road Transport and
ordination amongst offices and similar other deficiencies Highways.
are widely noticed. It is possible that some amount of
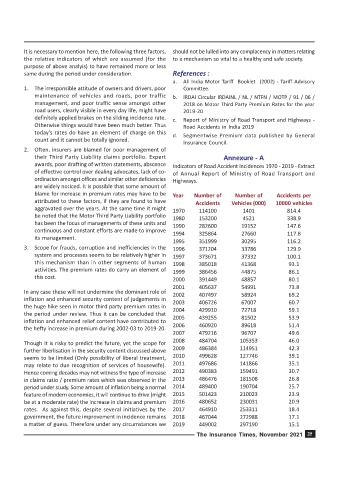
blame for increase in premium rates may have to be Year Number of Number of Accidents per
attributed to these factors, if they are found to have Accidents Vehicles (000) 10000 vehicles
aggravated over the years. At the same time it might 1970 114100 1401 814.4
be noted that the Motor Third Party Liability portfolio 1980 153200 4521 338.9
has been the focus of managements of these units and 1990 282600 19152 147.6
continuous and constant efforts are made to improve 1994 325864 27660 117.8
its management.
1995 351999 30295 116.2
3. Scope for frauds, corruption and inefficiencies in the 1996 371204 33786 129.9
system and processes seems to be relatively higher in 1997 373671 37332 100.1
this mechanism than in other segments of human 1998 385018 41368 93.1
activities. The premium rates do carry an element of 1999 386456 44875 86.1
this cost.
2000 391449 48857 80.1
2001 405637 54991 73.8
In any case these will not undermine the dominant role of 2002 407497 58924 69.2
inflation and enhanced security content of judgements in 2003 406726 67007 60.7
the huge hike seen in motor third party premium rates in 2004 429910 72718 59.1
the period under review. Thus it can be concluded that
2005 439255 81502 53.9
inflation and enhanced relief content have contributed to
the hefty increase in premium during 2002-03 to 2019-20. 2006 460920 89618 51.4
2007 479216 96707 49.6
Though it is risky to predict the future, yet the scope for 2008 484704 105353 46.0
further liberlisation in the security content discussed above 2009 486384 114951 42.3
seems to be limited (Only possibility of liberal treatment, 2010 499628 127746 39.1
may relate to due recognition of services of housewife). 2011 497686 141866 35.1
Hence coming decades may not witness the type of increase 2012 490383 159491 30.7
in claims ratio / premium rates which was observed in the 2013 486476 181508 26.8
period under study. Some amount of inflation being a normal 2014 489400 190704 25.7
feature of modern economies, it will continue to drive (might 2015 501423 210023 23.9
be at a moderate rate) the increase in claims and premium 2016 480652 230031 20.9
rates. As against this, despite several initiatives by the 2017 464910 253311 18.4
government, the future improvement in incidence remains 2018 467044 272988 17.1
a matter of guess. Therefore under any circumstances we 2019 449002 297190 15.1
The Insurance Times, November 2021 25