
Page 55 - BANKING FINANCE November 2015 ONLINE
P. 55
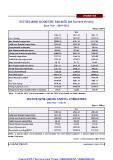
STATISTICS

SECTOR-WISE DOMESTIC SAVINGS (At Current Prices)

                                    Base Year : 2004-2005

                                                                                               (Rupees Billion)

Gross Savings                                  2013-14                 Year                    2011-12
Non-financial corporations                     34759.35             2012-13                    29939.26
Public non-financial corporations              12006.32             31812.63                   8773.86
Departmental enterprises                       1205.40              9787.32                    1228.53
Non-departmental enterprises                    321.50              1246.19
Private non-financial corporations              883.90               312.53                     247.69
Financial corporations                         10800.92              933.66                     980.84
Public financial corporations                  3217.52              8541.13                    7545.32
Departmental enterprises                       1702.20              3144.24                    2629.05
Non-departmental enterprises                                        1726.07                    1633.13
Private financial corporations                   54.75                                           42.85
General Government                             1647.45                51.73                    1590.28
Household sector                               1515.32              1674.34                     995.92
Gross financial saving #                       -1116.28             1418.17                    -1609.78
Less                                           20651.79             -1280.16                   20146.13
Financial Savings                              12792.54             20161.22                   9335.43
Saving in physical assets                      4598.04              10244.52                   2901.17
Saving in the form of gold & silver ornaments  8194.50              3302.18                    6434.27
                                               12123.02             6942.35                    13375.52
                                                334.27              12846.20                    336.35
                                                                     372.67

Note : 1. Data for 2012-13 are Provisional. 2. Data for 2011-12 are based on Quick Estimates.

SECTOR-WISE GROSS CAPITAL FORMATION

                                               Base Year : 2011-12

                                                                                               (Rupees Billion)

Public non-financial corporations              2011-12                 Year                    2013-14
Private non-financial corporations             3473.93              2012-13                    4234.10
Public Financial corporations                  11361.20             3630.76                    14025.00
Private Financial corporations                   84.28              13131.13                    119.76
General Government                              377.35               103.85                     272.34
Households including NPISH                     3185.74               329.25                    4666.62
                                               13375.52             3459.65                    12123.02
                                                                    12846.20

Notes : 1. Data for 2012-13 is Provisional. 2. Data for 2011-12 is First Revised Estimates. 3. Data for 2010-11 is Second
Revised Estimates.

                                                                                                   Source : Central Statistics Office (CSO).

BANKING FINANCE |                                                             NOVEMBER | 2015 | 55

Copyright@ The Insurance Times. 09883398055 / 09883380339