
Page 54 - Banking Finance October 2015
P. 54
STATISTICS
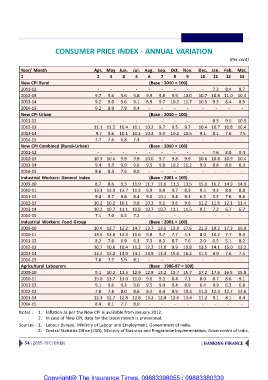
CONSUMER PRICE INDEX - ANNUAL VARIATION
(Per cent)
Year/ Month Apr. May Jun. Jul. Aug. Sep. Oct. Nov. Dec. Jan. Feb. Mar.
1 2 3 4 5 6 7 8 9 10 11 12 13
New CPI Rural (Base : 2010 = 100)
2011-12 -------- - 7.3 8.4 8.7
2012-13 9.7 9.6 9.6 9.8 9.9 9.8 9.9 10.0 10.7 10.8 11.0 10.4
2013-14 9.2 9.0 9.6 9.1 8.9 9.7 10.2 11.7 10.5 9.3 8.4 8.9
2014-15 9.2 8.9 7.9 8.4 - - - - - -- -
New CPI Urban (Base : 2010 = 100)
2011-12 -------- - 8.3 9.5 10.3
2012-13 11.1 11.5 10.4 10.1 10.2 9.7 9.5 9.7 10.4 10.7 10.8 10.4
2013-14 9.7 9.6 10.1 10.2 10.3 9.9 10.2 10.5 9.1 8.1 7.6 7.5
2014-15 7.7 7.6 6.8 7.4 - - - - --- -
New CPI Combined (Rural+Urban) (Base : 2010 = 100)
2011-12 -------- - 7.6 8.8 9.4
2012-13 10.3 10.4 9.9 9.9 10.0 9.7 9.8 9.9 10.6 10.8 10.9 10.4
2013-14 9.4 9.3 9.9 9.6 9.5 9.8 10.2 11.2 9.9 8.8 8.0 8.3
2014-15 8.6 8.3 7.5 8.0 - - - - --- -
Industrial Workers: General Index (Base : 2001 = 100)
2009-10 8.7 8.6 9.3 11.9 11.7 11.6 11.5 13.5 15.0 16.2 14.9 14.9
2010-11 13.3 13.9 13.7 11.3 9.9 9.8 9.7 8.3 9.5 9.3 8.8 8.8
2011-12 9.4 8.7 8.6 8.4 9.0 10.1 9.4 9.3 6.5 5.3 7.6 8.6
2012-13 10.2 10.2 10.1 9.8 10.3 9.1 9.6 9.6 11.2 11.6 12.1 11.4
2013-14 10.2 10.7 11.1 10.8 10.7 10.7 11.1 11.5 9.1 7.2 6.7 6.7
2014-15 7.1 7.0 6.5 7.2 - - - - -- --
Industrial Workers: Food Group (Base : 2001 = 100)
2009-10 10.4 11.7 12.2 14.7 13.7 13.5 13.8 17.6 21.3 19.2 17.3 16.0
2010-11 14.5 13.6 13.9 11.6 9.8 9.7 7.7 5.3 8.0 10.2 7.7 8.3
2011-12 8.2 7.6 6.9 6.3 7.3 8.3 8.7 7.6 2.0 0.5 5.1 8.2
2012-13 10.7 10.6 10.4 11.3 12.2 11.0 9.9 10.8 13.5 14.1 15.0 13.2
2013-14 12.4 13.2 14.9 14.1 13.9 13.4 15.0 16.2 11.5 8.9 7.6 7.5
2014-15 7.8 7.7 5.9 8.1 - - - - --- -
Agricultural Labourers (Base : 1986-87 = 100)
2009-10 9.1 10.2 11.5 12.9 12.9 13.2 13.7 15.7 17.2 17.6 16.5 15.8
2010-11 15.0 13.7 13.0 11.0 9.6 9.1 8.4 7.1 8.0 8.7 8.6 9.1
2011-12 9.1 9.6 9.3 9.0 9.5 9.4 9.4 8.9 6.4 4.9 6.3 6.8
2012-13 7.8 7.8 8.0 8.6 9.2 9.4 9.9 10.3 11.3 12.3 12.7 12.6
2013-14 12.3 12.7 12.8 12.8 13.2 12.8 12.6 13.4 11.2 9.1 8.1 8.4
2014-15 8.4 8.1 7.7 8.0 - - - - --- -
Notes : 1. Inflation as per the New CPI is available from January 2012.
2. In case of New CPI, data for the latest month is provisional.
Sources : 1. Labour Bureau, Ministry of Labour and Employment, Government of India.
2. Central Statistics Office (CSO), Ministry of Statistics and Programme Implementation, Government of India.
54 | 2015 | OCTOBER | BANKING FINANCE
Copyright@ The Insurance Times. 09883398055 / 09883380339