
Page 677 - Insurance Statistics 2021
P. 677
Indian Non-life Insurance Industry
Yearbook 2018-19
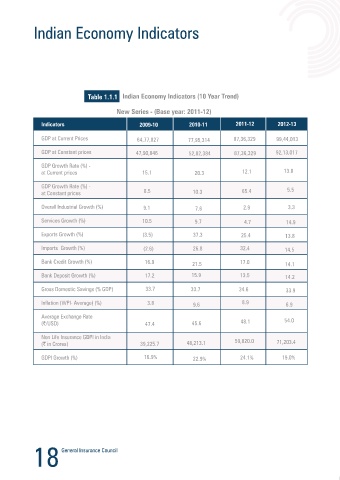
Indian Economy Indicators
Table 1.1.1
2017-18 2018-19
64,77,827 77,95,314 87,36,329 99,44,013 1,12,33,522 1,24,67,959 1,37,71,874 1,53,62,386 1,70,95,005 1,90,10,164
47,90,846 52,82,384 87,36,329 92,13,017 98,01,370 1,05,27,674 1,13,69,493 1,22,98,327 1,31,79,857 1,40,77,586
15.1 20.3 12.1 13.8 13.0 11.0 10.5 11.5 11.3 11.2
8.5 10.3 65.4 5.5 6.4 7.4 8.0 8.2 7.2 6.8
9.1 7.6 2.9 3.3 4.2 8.1 11.9 8.3 6.1 6.2
10.5 9.7 4.7 14.9 6.9 9.0 8.6 8.1 7.8 7.7
(3.5) 37.3 25.4 13.8 7.8 1.8 (5.7) 5.1 4.7 12.5
(2.6) 26.8 32.4 14.5 (8.1) 0.9 (5.9) 4.4 17.6 15.4
16.9 17.0 9.0 10.9 8.2 10.0 13.3
21.5 14.1 13.9
17.2 15.9 13.5 14.2 14.1 10.7 9.3 15.3 6.2 10.0
33.7 33.7 34.6 33.9 32.1 32.2 31.1 30.3 30.5 NA
3.8 9.6 8.9 6.9 5.2 1.3 (3.7) 1.7 2.9 4.3
47.4 45.6 48.1 54.0 60.4 62.4 66 .3 64.8 65.1 69.2
39,225.7 48,213.1 59,820.0 71,203.4 77,542.6 84,685.7 96,379.4 1,28,128.4 1,50,662.0 1,69,448.4
16.9% 22.9% 24.1% 19.0% 8.9% 9.2% 13.8% 32.9% 17.6% 12.5%
Source: RBI Handbook 2018-19
Note: GDP – Gross Domestic Product
GDPI – Gross Direct Premium in India
Figures provided by The RBI are updated with a lag of 12 months
18 19