
Page 680 - Insurance Statistics 2021
P. 680
Indian Non-life Insurance Industry
Yearbook 2018-19
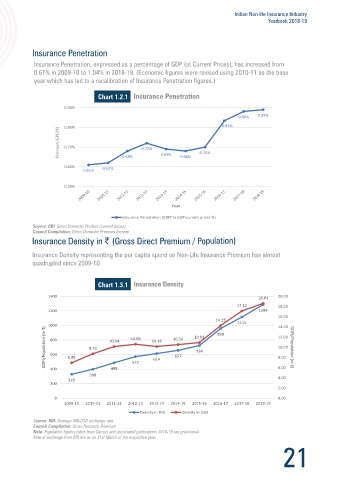
Insurance Penetration, expressed as a percentage of GDP (at Current Prices), has increased from
0.61% in 2009-10 to 1.04% in 2018-19. (Economic figures were revised using 2010-11 as the base
year which has led to a recalibration of Insurance Penetration figures.)
Chart 1.1.1
Chart 1.2.1 Insurance Penetration
35.0% 32.9%
- 0.90%
30.0% 0.89%
0.88%
24.1%
25.0% 16.9% 22.9% 19.0% 17.6% 0.80% 0.83%
Growth Rates, Inflation(%) 15.0% 3.8% 9.6% 12.1% 13.8% 13.0% 11.0% 10.5% 11.6% 11.3% 11.2% Premium/GPD(%) 0.70% 0.68% 0.72% 0.69% 0.68% 0.70%
20.0%
20.3%
13.8%
12.5%
15.1%
8.9%
8.9%
10.0%
6.9%
5.2%
9.2%
4.3%
5.0%
0.0% 1.3% 1.7% 2.9% 0.60% 0.61% 0.62%
-5.0%
-3.7% 0.50%
-10.0%
2009-10 2010-11 2011-12 2012-13 2013-14 2014-15 2015-16 2016-17 2017-18 2018-19
Year
Year
Insurance Penetration (GDPI to GDP-current prices %)
GDP Growth Rate (%) at Current Prices Inflation (WPI- Average) (%) Growth in Non-Life Insurance (%)
Source: RBI: Gross Domestic Product (current prices)
Source: RBI (Gross Domestic Product) Council Compilation: Gross Domestic Premium Income
Council Compilation: Growth in Non-Life Insurance(%)
Secondary Source: Indiastats: Inflation (WPI-Average)(%)
Non-Life Insurance Industry growth during the period 2009-10 to 2018-19 has been continued to outperform Insurance Density representing the per capita spend on Non-Life Insurance Premium has almost
the Industrial and Services growth rates. quadrupled since 2009-10.
Chart 1.1.2 Chart 1.3.1
1400 20.00
18.61
35.0%
32.9% 17.12 18.00
1200 1287
30.0%
16.00
14.25 1115
25.0% 24.1% 1000 14.00
22.9% 10.92 958 12.00
Growth Rate(%) 20.0% 16.9% 14.9% 13.8% 17.6% GDPI/Population (in ₹) 800 8.73 10.14 10.59 10.16 10.54 724 10.00 GDPI/Population (in $)
19.0%
15.0%
600
10.5%
9.7% 12.5% 6.95 572 614 657 8.00
9.0%
10.0% 8.9% 9.2% 11.9% 8.1% 7.8% 7.7%
400 488 6.00
9.2% 4.7% 8.3%
7.6% 8.1% 8.6% 398
5.0% 6.9% 6.1% 6.2% 329 4.00
4.2% 200
2.9% 3.3% 2.00
0.0%
2009-10 2010-11 2011-12 2012-13 2013-14 2014-15 2015-16 2016-17 2017-18 2018-19
0 0.00
Year 2009-10 2010-11 2011-12 2012-13 2013-14 2014-15 2015-16 2016-17 2017-18 2018-19
Overall Industrial Growth (%) Services growth (%) Growth in Non-Life Insurance (%) Density in INR Density in USD
Source: RBI: Overall Industrial Growth (%) Source: RBI: Average INR-USD exchange rate
Council Compilation: Growth in Non-Life Insurance (%) Council Compilation: Gross Domestic Premium
Secondary Source: Indiastats: Services Growth (%) Note: Population figures taken from Census and associated publications 2018-19 are provisional.
Rate of exchange from RBI are as on 31st March of the respective year.
20 21