
Page 41 - Divyank Tyagi
P. 41
|
LeveragIng BIM Processes 7
Visualizing
Creating documentation using BIM gives you the added advantage of being able to visualize the
project in 3D. Although this was initially conceived as one of the “low-hanging fruits” of a BIM
workflow, this benefit has led to an explosion of 3D graphics—perspectives, wire frames, cloud
renderings, and animations—within the industry as a means to communicate design between
stakeholders on a project.
This digital creation of the project has given us a variety of tools to communicate aspects
of the project. It becomes “architecture in miniature,” and we can take the model and create
a seemingly unlimited number of interior and exterior visualizations. The same model may
be imported into a gaming engine similar to an Xbox for an interactive virtual experience.
Clients no longer need to rely on the designer’s pre-established paths in a fly-through—they
can virtually “walk” through the building at their own pace, exploring an endless variety of
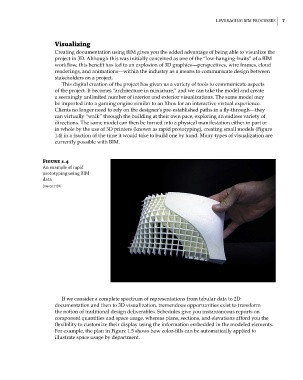
directions. The same model can then be turned into a physical manifestation either in part or
in whole by the use of 3D printers (known as rapid prototyping), creating small models (Figure
1.4) in a fraction of the time it would take to build one by hand. Many types of visualization are
currently possible with BIM.
Figure 1.4
an example of rapid
prototyping using BIM
data
Source: HOK
If we consider a complete spectrum of representations from tabular data to 2D
documentation and then to 3D visualization, tremendous opportunities exist to transform
the notion of traditional design deliverables. Schedules give you instantaneous reports on
component quantities and space usage, whereas plans, sections, and elevations afford you the
flexibility to customize their display using the information embedded in the modeled elements.
For example, the plan in Figure 1.5 shows how color-fills can be automatically applied to
illustrate space usage by department.
c01.indd 7 05-05-2014 16:36:39