
Page 44 - Divyank Tyagi
P. 44
10 | ChAPTeR 1 IntroductIon: the BasIcs of BIM
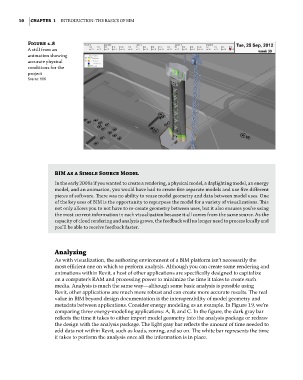
Figure 1.8
a still from an
animation showing
accurate physical
conditions for the
project
Source: HOK
BIM as a Single Source Model
In the early 2000s if you wanted to create a rendering, a physical model, a daylighting model, an energy
model, and an animation, you would have had to create five separate models and use five different
pieces of software. There was no ability to reuse model geometry and data between model uses. one
of the key uses of BIM is the opportunity to repurpose the model for a variety of visualizations. This
not only allows you to not have to re-create geometry between uses, but it also ensures you’re using
the most current information in each visualization because it all comes from the same source. as the
capacity of cloud rendering and analysis grows, the feedback will no longer need to process locally and
you’ll be able to receive feedback faster.
Analyzing
As with visualization, the authoring environment of a BIM platform isn’t necessarily the
most efficient one on which to perform analysis. Although you can create some rendering and
animations within Revit, a host of other applications are specifically designed to capitalize
on a computer’s RAM and processing power to minimize the time it takes to create such
media. Analysis is much the same way—although some basic analysis is possible using
Revit, other applications are much more robust and can create more accurate results. The real
value in BIM beyond design documentation is the interoperability of model geometry and
metadata between applications. Consider energy modeling as an example. In Figure 1.9, we’re
comparing three energy-modeling applications: A, B, and C. In the figure, the dark gray bar
reflects the time it takes to either import model geometry into the analysis package or redraw
the design with the analysis package. The light gray bar reflects the amount of time needed to
add data not within Revit, such as loads, zoning, and so on. The white bar represents the time
it takes to perform the analysis once all the information is in place.
c01.indd 10 05-05-2014 16:36:47