
Page 47 - Divyank Tyagi
P. 47
|
focusIng Your InvestMent In BIM 13
Identifying the importance of visualization, analysis, and strategy to your process will help
guide you in selecting areas of implementation within your own practice. If your investment
(regardless of scale) is focused and well planned, it will yield strong results. When choosing
areas of implementation or how much focus to give to these areas, there are no wrong answers.
Just choose a path that reflects the comfort level of your firm while maintaining focus on
achieving success.
We elaborate on most of these topics throughout the remainder of this book. Using real-world
examples, we illustrate a variety of techniques to visualize, analyze, and strategize using Revit.
Staffing for BIM
As you rethink the process of design and documentation, one of the fundamental changes
you will need to address is staffing. A common misconception of project management when
teams are first moving from CAD to BIM is that staffing the project will be the same in both
workflows. This couldn’t be further from the truth because when the workflow changes: staffing
allocations, the time to complete tasks, and the percentage of work by phase are all affected as a
result of the changes.
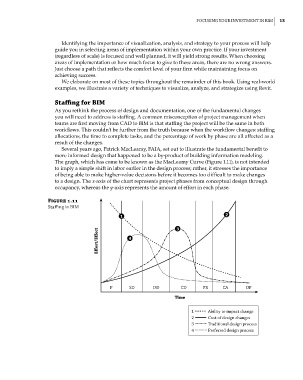
Several years ago, Patrick MacLeamy, FAIA, set out to illustrate the fundamental benefit to
more informed design that happened to be a by-product of building information modeling.
The graph, which has come to be known as the MacLeamy Curve (Figure 1.11), is not intended
to imply a simple shift in labor earlier in the design process; rather, it stresses the importance
of being able to make higher-value decisions before it becomes too difficult to make changes
to a design. The x-axis of the chart represents project phases from conceptual design through
occupancy, whereas the y-axis represents the amount of effort in each phase.
Figure 1.11
staffing in BIM
1 2
Eort/Eect 4 3
P SD DD CD PR CA OP
Time
1 Ability to impact change
2 Cost of design changes
3 Traditional design process
4 Preferred design process
c01.indd 13 05-05-2014 16:36:50