
Page 18 - Food Outlook
P. 18
last year’s levels. This is primarily because of tighter supplies of high quality wheat in the face of rising world demand, as illustrated in Box 1. Wheat futures have followed a similar movement since the beginning of the current season. In October, the Chicago Board of Trade (CBOT) quotation for December delivery averaged USD161 per tonne, up
7 percent from October 2016. More detailed analysis of the futures markets can be found in Box 1 as well as in the Market Indicators section of this report.
PRODUCTION
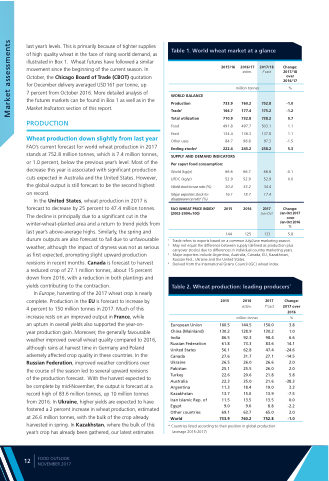
Wheat production down slightly from last year
FAO’s current forecast for world wheat production in 2017 stands at 752.8 million tonnes, which is 7.4 million tonnes, or 1.0 percent, below the previous year’s level. Most of the decrease this year is associated with significant production cuts expected in Australia and the United States. However, the global output is still forecast to be the second highest on record.
In the United States, wheat production in 2017 is forecast to decrease by 25 percent to 47.4 million tonnes. The decline is principally due to a significant cut in the winter-wheat-planted area and a return to trend yields from last year’s above-average highs. Similarly, the spring and durum outputs are also forecast to fall due to unfavourable weather, although the impact of dryness was not as serious as first expected, prompting slight upward production revisions in recent months. Canada is forecast to harvest
a reduced crop of 27.1 million tonnes, about 15 percent down from 2016, with a reduction in both plantings and yields contributing to the contraction.
In Europe, harvesting of the 2017 wheat crop is nearly complete. Production in the EU is forecast to increase by
4 percent to 150 million tonnes in 2017. Much of this increase rests on an improved output in France, while
an upturn in overall yields also supported the year-on-
year production gain. Moreover, the generally favourable weather improved overall wheat quality compared to 2016, although rains at harvest time in Germany and Poland adversely affected crop quality in these countries. In the Russian Federation, improved weather conditions over
the course of the season led to several upward revisions
of the production forecast. With the harvest expected to
be complete by mid-November, the output is forecast at a record high of 83.6 million tonnes, up 10 million tonnes from 2016. In Ukraine, higher yields are expected to have fostered a 2 percent increase in wheat production, estimated at 26.6 million tonnes, with the bulk of the crop already harvested in spring. In Kazakhstan, where the bulk of this year’s crop has already been gathered, our latest estimates
Table 1. World wheat market at a glance
WORLD BALANCE Production
Trade1
Total utilization Food
Feed
Other uses Ending stocks2
2015/16 2016/17
estim.
million tonnes
733.9 760.2 166.7 177.4 710.9 732.8 491.8 497.7 134.4 136.3
84.7 98.8
222.4 245.2
Change: 2017/18 over 2016/17
%
-1.0 -1.2 0.7 1.1 1.1 -1.5 5.3
-0.1 0.0
Change: Jan-Oct 2017 over Jan-Oct 2016 %
5.8
752.8 175.2 738.2 503.1 137.8
97.3
258.2
SUPPLY AND DEMAND INDICATORS Per caput food consumption:
World (kg/yr)
LIFDC (kg/yr)
World stock-to-use ratio (%)
Major exporters stock-to- disappearance ratio3 (%)
FAO WHEAT PRICE INDEX4 (2002-2004=100)
66.6 66.7 52.9 52.9 30.4 33.2 16.1 18.7
2015 2016
144 125
66.6 52.9 34.4 17.4
2017
Jan-Oct
133
1 Trade refers to exports based on a common July/June marketing season.
2 May not equal the difference between supply (defined as production plus carryover stocks) due to differences in individual country marketing years.
3 Major exporters include Argentina, Australia, Canada, EU, Kazakhstan, Russian Fed., Ukraine and the United States.
4 Derived from the International Grains Council (IGC) wheat index.
Table 2. Wheat production: leading producers*
European Union China (Mainland) India
Russian Federation United States Canada
Ukraine
Pakistan
Turkey
Australia Argentina Kazakhstan
Iran Islamic Rep. of Egypt
Other countries
2015 2016 2017
estim. f”cast
million tonnes
160.5 144.5 150.0 130.2 128.9 130.2 86.5 92.3 98.4 61.8 73.3 83.6 56.1 62.8 47.4 27.6 31.7 27.1 26.5 26.0 26.6 25.1 25.5 26.0 22.6 20.6 21.8 22.3 35.0 21.6 11.3 18.4 19.0 13.7 15.0 13.9 11.5 13.5 13.5 9.0 9.0 8.8 69.1 63.7 65.0
Change: 2017 over 2016
%
3.8 1.0 6.6
14.1 -24.6 -14.5
2.0 2.0 5.8
-38.3 3.3 -7.5 0.0 -2.2 2.0 -1.0
World 733.9
760.2 752.8
* Countries listed according to their position in global production (average 2015-2017)
2017/18
f’cast
12
FOOD OUTLOOK NOVEMBER 2017
Market assessments
