
Page 40 - Food Outlook
P. 40
Market assessments
PRICES
International quotations of cassava products in 2017 reverse earlier sharp falls
Monthly reference prices of internationally traded cassava, a market that is mostly confined to East and Southeast Asia, have recovered in the latter half of 2017, after having fallen to multi-year lows.
Thai chips prices (f.o.b. Bangkok) were quoted at around USD 185 per tonne in October 2017, some
8 percent higher than in the corresponding month of last year and 19 percent more than in May 2017, when they plummeted to a 8-year low. Thai flour and starch prices (Super High Grade, f.o.b. Bangkok) were being quoted at around USD 350 per tonne, 11 percent higher than in October 2016, when they also fell to a 7-year low.
The turnaround to the trend in quotations is entirely on account of developments in China – the major destination for internationally traded cassava products. Last year,
the country began to implement measures to lower its accumulated stockpiles of maize, with the state grain reserves body auctioning large volumes, which were deemed unfit for human consumption, to its feed and industrial sectors. As imported cassava and maize compete fiercely in these sectors, China’s maize stock release had a significant effect on cassava quotations, especially given the thinness
of the international market for cassava. The removal of minimum support prices for maize in China also made domestic maize more competitive with imported substitutes,
further pressurizing cassava quotations. However, drought- induced lower plantings and logistical constraints in supply have significantly disrupted the 2017/18 maize season in China, resulting in prices of domestic maize climbing well above counterpart international quotations. This resurgence
Table 1. World cassava market at a glance
34
FOOD OUTLOOK NOVEMBER 2017
CASSAVA
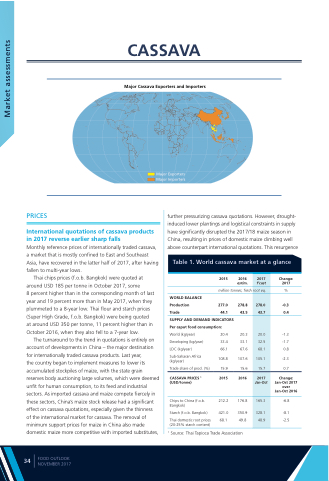
Major Cassava Exporters and Importers
Major Exporters Major Importers
WORLD BALANCE
Production
Trade
SUPPLY AND DEMAND INDICATORS Per caput food consumption:
278.0 -0.3 43.7 0.4
20.0 -1.3 32.5 -1.7 68.1 0.8
105.1 -2.3 15.7 0.7
2017 Change: Jan-Oct Jan-Oct 2017
over Jan-Oct 2016
165.3 -6.8
328.1 -8.1 48.9 -2.5
World (kg/year)
Developing (kg/year)
LDC (kg/year)
Sub-Saharan Africa (kg/year)
Trade share of prod. (%)
CASSAVA PRICES 1 (USD/tonne)
Chips to China (f.o.b. Bangkok)
Starch (f.o.b. Bangkok)
Thai domestic root prices (20-25% starch content)
20.4 20.3 33.4 33.1 66.1 67.6
108.8 107.6 15.9 15.6 2015 2016
212.2 176.8
421.0 350.9 68.1 49.8
1 Source: Thai Tapioca Trade Association
2015 2016 2017
estim. f’cast
million tonnes, fresh root eq.
Change: 2017
%
277.0 278.8 44.1 43.5
