
Page 67 - Food Outlook
P. 67
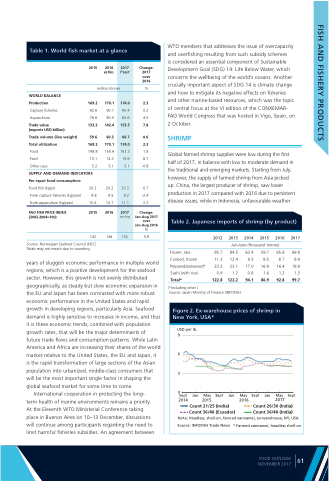
  Table 1. World fish market at a glance
WTO members that addresses the issue of overcapacity and overfishing resulting from such subsidy schemes
is considered an essential component of Sustainable Development Goal (SDG) 14: Life Below Water, which concerns the wellbeing of the world’s oceans. Another crucially important aspect of SDG 14 is climate change and how to mitigate its negative effects on fisheries and other marine-based resources, which was the topic of central focus at the VI edition of the CONXEMAR- FAO World Congress that was hosted in Vigo, Spain, on 2 October.
SHRIMP
Global farmed shrimp supplies were low during the first half of 2017, in balance with low to moderate demand in the traditional and emerging markets. Starting from July, however, the supply of farmed shrimp from Asia picked up. China, the largest producer of shrimp, saw lower production in 2017 compared with 2016 due to persistent disease issues, while in Indonesia, unfavourable weather
Table 2. Japanese imports of shrimp (by product)
 2015
million tonnes
2016
estim.
Change: 2017 over 2016
%
2.3
0.3 4.5 7.8
0.6 2.3 1.8 8.7
-0.8
0.7 -2.4 3.3
Change: Jan-Aug 2017 over Jan-Aug 2016 %
5.9
      WORLD BALANCE
Production 169.2
170.1
90.1
80.0
142.4
60.3 170.1 150.6
Feed 15.1 14.3
Capture fisheries
Aquaculture
Trade value
(exports USD billion)
Trade volume (live weight) Total utilization
92.6
76.6
133.2
59.6 169.2 Food 148.8
174.0
90.4
83.6
153.5
60.7 174.0 153.3
15.6 5.1
  Other uses 5.2
SUPPLY AND DEMAND INDICATORS Per caput food consumption:
5.1
   Food fish (kg/yr)
From capture fisheries (kg/year) From aquaculture (kg/year)
FAO FISH PRICE INDEX (2002-2004=100)
20.2 20.2 9.8 9.5 10.4 10.7
2015 2016
142 146
20.3 9.2 11.1
    2017
Jan-Aug
    152
    Source: Norwegian Seafood Council (NSC) Totals may not match due to rounding.
2012 2013 2014 2015 2016 2017
Jan-June (thousand tonnes)
 years of sluggish economic performance in multiple world regions, which is a positive development for the seafood sector. However, this growth is not evenly distributed geographically, as steady but slow economic expansion in the EU and Japan has been contrasted with more robust economic performance in the United States and rapid growth in developing regions, particularly Asia. Seafood demand is highly sensitive to increases in income, and thus it is these economic trends, combined with population growth rates, that will be the major determinants of future trade flows and consumption patterns. While Latin America and Africa are increasing their shares of the world market relative to the United States, the EU and Japan, it is the rapid transformation of large sections of the Asian population into urbanized, middle-class consumers that will be the most important single factor in shaping the global seafood market for some time to come.
International cooperation in protecting the long- term health of marine environments remains a priority. At the Eleventh WTO Ministerial Conference taking place in Buenos Aires on 10–13 December, discussions will continue among participants regarding the need to limit harmful fisheries subsidies. An agreement between
Frozen, raw Cooked, frozen Prepared/preserved*
Sushi (with rice)
Total*
85.7 84.5 63.4 11.3 12.4 9.5 23.2 23.1 17.0
0.9 1.2 0.8
122.8 122.2 94.1
59.7 65.8 69.8 8.5 8.7 8.9 16.9 16.4 18.9 1.6 1.2 1.3 86.9 92.8 99.7
2017
f’cast
 (*Including other )
Source: Japan Ministry of Finance /INFOFISH
 Figure 2. Ex-warehouse prices of shrimp in New York, USA*
 USD per lb.
9
6
3
0
Sept Jan May Sept Jan May Sept Jan May Sept
                                          2014 2015 2016
Count 21/25 (India)
Count 36/40 (Ecuador)
2017
Count 26/30 (India)
Count 36/40 (India)
    Note: Headless, shell-on, farmed vannamei, ex-warehouse, NY, USA Source: INFOFISH Trade News * Farmed vannamei, headless shell-on
     FOOD OUTLOOK NOVEMBER 2017
61
FISH AND FISHERY PRODUCTS
