
Page 7 - Food Outlook
P. 7
CEREALS
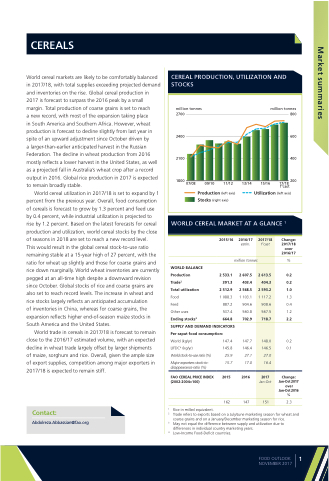
World cereal markets are likely to be comfortably balanced in 2017/18, with total supplies exceeding projected demand and inventories on the rise. Global cereal production in 2017 is forecast to surpass the 2016 peak by a small margin. Total production of coarse grains is set to reach
a new record, with most of the expansion taking place
in South America and Southern Africa. However, wheat production is forecast to decline slightly from last year in spite of an upward adjustment since October driven by
a larger-than-earlier anticipated harvest in the Russian Federation. The decline in wheat production from 2016 mostly reflects a lower harvest in the United States, as well as a projected fall in Australia’s wheat crop after a record output in 2016. Global rice production in 2017 is expected to remain broadly stable.
World cereal utilization in 2017/18 is set to expand by 1 percent from the previous year. Overall, food consumption of cereals is forecast to grow by 1.3 percent and feed use by 0.4 percent, while industrial utilization is projected to rise by 1.2 percent. Based on the latest forecasts for cereal production and utilization, world cereal stocks by the close of seasons in 2018 are set to reach a new record level.
This would result in the global cereal stock-to-use ratio remaining stable at a 15-year high of 27 percent, with the ratio for wheat up slightly and those for coarse grains and rice down marginally. World wheat inventories are currently pegged at an all-time high despite a downward revision since October. Global stocks of rice and coarse grains are also set to reach record levels. The increase in wheat and rice stocks largely reflects an anticipated accumulation
of inventories in China, whereas for coarse grains, the expansion reflects higher end-of-season maize stocks in South America and the United States.
World trade in cereals in 2017/18 is forecast to remain close to the 2016/17 estimated volume, with an expected decline in wheat trade largely offset by larger shipments of maize, sorghum and rice. Overall, given the ample size of export supplies, competition among major exporters in 2017/18 is expected to remain stiff.
Contact:
Abdolreza.Abbassian@fao.org
CEREAL PRODUCTION, UTILIZATION AND STOCKS
million tonnes
2700
2400
2100
1800 07/08
09/10
11/12
13/14
15/16
million tonnes
800
600
400
17/18 200 f’cast
Production (left axis) Stocks (right axis)
Utilization (left axis)
WORLD CEREAL MARKET AT A GLANCE 1
2017/18
f’cast
s
2 613.5 404.3 2 593.2 1 117.2 908.6 567.5 718.7
148.0 146.5 27.0 16.4
2017
Jan-Oct
151
2015/16
WORLD BALANCE
Production
Trade2 391.3 Total utilization 2 512.9 Food 1 088.3 Feed 887.2 Other uses 537.4 Ending stocks3 664.8
SUPPLY AND DEMAND INDICATORS Per caput food consumption:
2 533.1
2016/17
estim.
million tonne
2 607.5 403.4 2 568.5
Change: 2017/18 over 2016/17
%
0.2 0.2 1.0 1.3 0.4 1.2 2.2
0.2 0.1
Change: Jan-Oct 2017 over Jan-Oct 2016 %
2.3
1
103.1 904.6 560.8 702.9
147.7 146.4 27.1 17.0
2016
147
World (kg/yr)
LIFDC4 (kg/yr)
World stock-to-use ratio (%)
Major exporters stock-to- disappearance ratio (%)
FAO CEREAL PRICE INDEX (2002-2004=100)
147.4 145.8 25.9 15.7
2015
162
1 Rice in milled equivalent.
2 Trade refers to exports based on a July/June marketing season for wheat and
coarse grains and on a January/December marketing season for rice. 3 May not equal the difference between supply and utilization due to
differences in individual country marketing years. 4 Low-Income Food-Deficit countries.
FOOD OUTLOOK NOVEMBER 2017
1
Market summaries
