
Page 8 - Food Outlook
P. 8
WHEAT
Even though world wheat production in 2017 is forecast to fall below last year’s record level, wheat supplies in 2017/18 remain relatively large. Stocks are set to increase for the fifth consecutive season, reaching an all-time high. Trade
is expected to contract, while prices, which still exceed last year’s levels, have remained under general downward pressure since the start of the season.
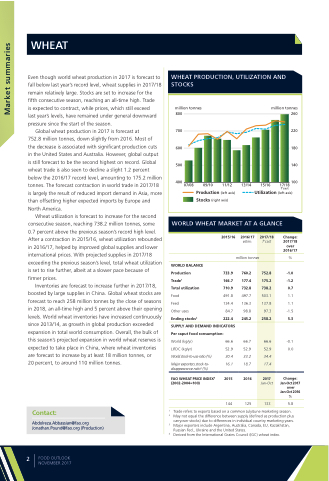
Global wheat production in 2017 is forecast at
752.8 million tonnes, down slightly from 2016. Most of
the decrease is associated with significant production cuts in the United States and Australia. However, global output is still forecast to be the second highest on record. Global wheat trade is also seen to decline a slight 1.2 percent below the 2016/17 record level, amounting to 175.2 million tonnes. The forecast contraction in world trade in 2017/18 is largely the result of reduced import demand in Asia, more than offsetting higher expected imports by Europe and North America.
Wheat utilization is forecast to increase for the second consecutive season, reaching 738.2 million tonnes, some 0.7 percent above the previous season’s record high level. After a contraction in 2015/16, wheat utilization rebounded in 2016/17, helped by improved global supplies and lower international prices. With projected supplies in 2017/18 exceeding the previous season’s level, total wheat utilization is set to rise further, albeit at a slower pace because of firmer prices.
Inventories are forecast to increase further in 2017/18, boosted by large supplies in China. Global wheat stocks are forecast to reach 258 million tonnes by the close of seasons in 2018, an all-time high and 5 percent above their opening levels. World wheat inventories have increased continuously since 2013/14, as growth in global production exceeded expansion in total world consumption. Overall, the bulk of this season’s projected expansion in world wheat reserves is expected to take place in China, where wheat inventories are forecast to increase by at least 18 million tonnes, or
20 percent, to around 110 million tonnes.
Contact:
Abdolreza.Abbassian@fao.org Jonathan.Pound@fao.org (Production)
WHEAT PRODUCTION, UTILIZATION AND STOCKS
million tonnes
800
700
600
500
400 07/08
09/10
11/12
13/14
15/16
million tonnes
260
220
180
140
17/18 100 f’cast
Production (left axis) Stocks (right axis)
Utilization (left axis)
WORLD WHEAT MARKET AT A GLANCE
WORLD BALANCE Production
Trade1
Total utilization Food
Feed
Other uses Ending stocks2
2015/16
733.9 166.7 710.9 491.8 134.4
84.7
222.4
2016/17
estim.
million tonnes
760.2 177.4 732.8 497.7 136.3
98.8
245.2
Change: 2017/18 over 2016/17
%
-1.0 -1.2 0.7 1.1 1.1 -1.5 5.3
-0.1 0.0
Change: Jan-Oct 2017 over Jan-Oct 2016 %
5.8
752.8 175.2 738.2 503.1 137.8
97.3
258.2
SUPPLY AND DEMAND INDICATORS Per caput food consumption:
World (kg/yr)
LIFDC (kg/yr)
World stock-to-use ratio (%)
Major exporters stock-to- disappearance ratio3 (%)
FAO WHEAT PRICE INDEX4 (2002-2004=100)
66.6 66.7 52.9 52.9 30.4 33.2 16.1 18.7
2015 2016
144 125
66.6 52.9 34.4 17.4
2017
Jan-Oct
133
1 2
3 4
Trade refers to exports based on a common July/June marketing season. May not equal the difference between supply (defined as production plus carryover stocks) due to differences in individual country marketing years. Major exporters include Argentina, Australia, Canada, EU, Kazakhstan, Russian Fed., Ukraine and the United States.
Derived from the International Grains Council (IGC) wheat index.
2017/18
f’cast
2
FOOD OUTLOOK NOVEMBER 2017
Market summaries
