
Page 10 - Food Outlook
P. 10
RICE
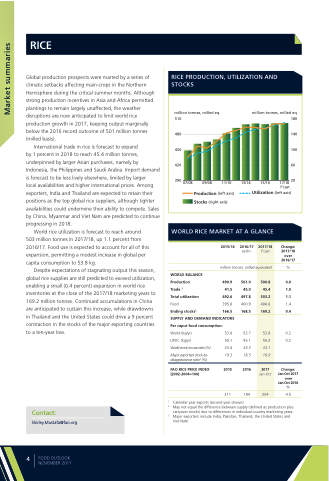
Global production prospects were marred by a series of climatic setbacks affecting main-crops in the Northern Hemisphere during the critical summer months. Although strong production incentives in Asia and Africa permitted plantings to remain largely unaffected, the weather disruptions are now anticipated to limit world rice production growth in 2017, keeping output marginally below the 2016 record outcome of 501 million tonnes (milled basis).
International trade in rice is forecast to expand
by 1 percent in 2018 to reach 45.4 million tonnes, underpinned by larger Asian purchases, namely by Indonesia, the Philippines and Saudi Arabia. Import demand is forecast to be less lively elsewhere, limited by larger
local availabilities and higher international prices. Among exporters, India and Thailand are expected to retain their positions as the top global rice suppliers, although tighter availabilities could undermine their ability to compete. Sales by China, Myanmar and Viet Nam are predicted to continue progressing in 2018.
World rice utilization is forecast to reach around 503 million tonnes in 2017/18, up 1.1 percent from 2016/17. Food use is expected to account for all of this expansion, permitting a modest increase in global per capita consumption to 53.8 kg.
Despite expectations of stagnating output this season, global rice supplies are still predicted to exceed utilization, enabling a small (0.4 percent) expansion in world rice inventories at the close of the 2017/18 marketing years to 169.2 million tonnes. Continued accumulations in China are anticipated to sustain this increase, while drawdowns in Thailand and the United States could drive a 9 percent contraction in the stocks of the major exporting countries to a ten-year low.
RICE PRODUCTION, UTILIZATION AND STOCKS
million tonnes, milled eq.
million tonnes, milled eq.
510 480 450 420
390 07/08
09/08
11/10
13/14
15/16
180 140 100 60
17/18 20 f’cast
Production (left axis) Stocks (right axis)
Utilization (left axis)
WORLD RICE MARKET AT A GLANCE
2015/16 2016/17
estim.
million tonnes, milled equivalent
Change: 2017/18 over 2016/17
%
0.0 1.0 1.1 1.4 0.4
0.2 0.2
Change: Jan-Oct 2017 over Jan-Oct 2016 %
4.5
2017/18
f’cast
WORLD BALANCE
Production 490.9 Trade 1 41.5 Total utilization 492.6 Food 395.8 Ending stocks2 166.5
SUPPLY AND DEMAND INDICATORS
Per caput food consumption:
World (kg/yr) 53.6
LIFDC (kg/yr) 55.1
501.0 45.0 497.8 400.9 168.5
53.7 55.1
500.8 45.4 503.2 406.6 169.2
World stock-to-use ratio (%) 33.4 33.5
Major exporters stock-to- 19.3 18.5
disappearance ratio3 (%)
FAO RICE PRICE INDEX 2015 (2002-2004=100)
211
2016
194
53.8 55.2 33.1 16.9
2017
Jan-Oct
204
Contact:
Shirley.Mustafa@fao.org
1 2
3
Calendar year exports (second year shown).
May not equal the difference between supply (defined as production plus carryover stocks) due to differences in individual country marketing years. Major exporters include India, Pakistan, Thailand, the United States and Viet Nam.
4
FOOD OUTLOOK NOVEMBER 2017
Market summaries
