
Page 9 - Food Outlook
P. 9
COARSE GRAINS
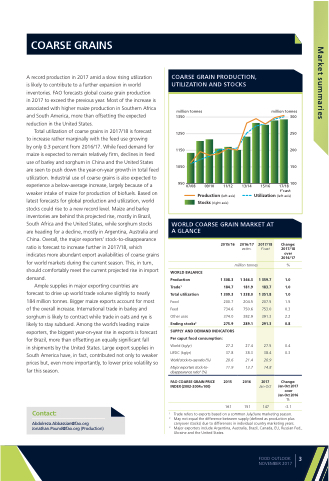
A record production in 2017 amid a slow rising utilization is likely to contribute to a further expansion in world inventories. FAO forecasts global coarse grain production in 2017 to exceed the previous year. Most of the increase is associated with higher maize production in Southern Africa and South America, more than offsetting the expected reduction in the United States.
Total utilization of coarse grains in 2017/18 is forecast
to increase rather marginally with the feed use growing
by only 0.3 percent from 2016/17. While feed demand for maize is expected to remain relatively firm, declines in feed use of barley and sorghum in China and the United States are seen to push down the year-on-year growth in total feed utilization. Industrial use of coarse grains is also expected to experience a below-average increase, largely because of a weaker intake of maize for production of biofuels. Based on latest forecasts for global production and utilization, world stocks could rise to a new record level. Maize and barley inventories are behind this projected rise, mostly in Brazil, South Africa and the United States, while sorghum stocks are heading for a decline, mostly in Argentina, Australia and China. Overall, the major exporters’ stock-to-disappearance ratio is forecast to increase further in 2017/18, which indicates more abundant export availabilities of coarse grains for world markets during the current season. This, in turn, should comfortably meet the current projected rise in import demand.
Ample supplies in major exporting countries are
forecast to drive up world trade volume slightly to nearly 184 million tonnes. Bigger maize exports account for most of the overall increase. International trade in barley and sorghum is likely to contract while trade in oats and rye is likely to stay subdued. Among the world’s leading maize exporters, the biggest year-on-year rise in exports is forecast for Brazil, more than offsetting an equally significant fall
in shipments by the United States. Large export supplies in South America have, in fact, contributed not only to weaker prices but, even more importantly, to lower price volatility so far this season.
Contact:
Abdolreza.Abbassian@fao.org Jonathan.Pound@fao.org (Production)
COARSE GRAIN PRODUCTION, UTILIZATION AND STOCKS
million tonnes
million tonnes
300 250 200 150
17/18 100 f’cast
1350 1250 1150 1050
950 07/08
09/10
11/12
13/14
15/16
Production (left axis) Stocks (right axis)
Utilization (left axis)
WORLD COARSE GRAIN MARKET AT A GLANCE
2015/16 2016/17
estim.
million tonne
1 346.3 181.9 1 338.0 204.5 750.6 382.9 289.1
Change: 2017/18 over 2016/17
%
1.0 1.0 1.0 1.5 0.3 2.2 0.8
0.4 0.3
Change: Jan-Oct 2017 over Jan-Oct 2016 %
-3.1
2017/18
f’cast
s
1 359.7 183.7 1 351.8 207.5 753.0 391.3 291.3
27.5 38.4 20.9 14.8
2017
Jan-Oct
147
WORLD BALANCE
Production
Trade1 184.7 Total utilization 1 309.3 Food 200.7 Feed 734.6 Other uses 374.0 Ending stocks2 275.9
SUPPLY AND DEMAND INDICATORS Per caput food consumption:
1 308.3
World (kg/yr)
LIFDC (kg/yr)
World stock-to-use ratio (%)
Major exporters stock-to- disappearance ratio3 (%)
FAO COARSE GRAIN PRICE INDEX (2002-2004=100)
27.2 27.4 37.8 38.3 20.6 21.4 11.9 13.7
2015 2016
161 151
1 Trade refers to exports based on a common July/June marketing season.
2 May not equal the difference between supply (defined as production plus carryover stocks) due to differences in individual country marketing years.
3 Major exporters include Argentina, Australia, Brazil, Canada, EU, Russian Fed., Ukraine and the United States.
FOOD OUTLOOK NOVEMBER 2017
3
Market summaries
