
Page 70 - Food Outlook
P. 70
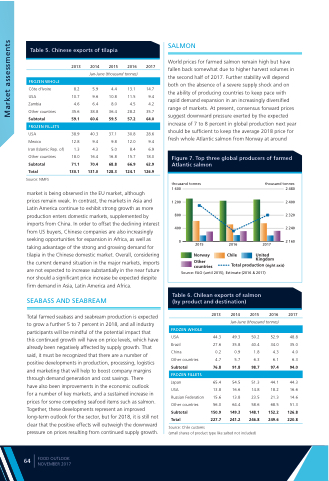
   Table 5. Chinese exports of tilapia
SALMON
  2013 2014 2015 2016 2017
Jan-June (thousand tonnes)
World prices for farmed salmon remain high but have fallen back somewhat due to higher harvest volumes in the second half of 2017. Further stability will depend both on the absence of a severe supply shock and on the ability of producing countries to keep pace with rapid demand expansion in an increasingly diversified range of markets. At present, consensus forward prices suggest downward pressure exerted by the expected increase of 7 to 8 percent in global production next year should be sufficient to keep the average 2018 price for fresh whole Atlantic salmon from Norway at around
Figure 7. Top three global producers of farmed Atlantic salmon
  FROZEN WHOLE
      Côte d'Ivoire USA
Zambia
Other countries Subtotal
8.2 5.9 4.4 10.7 9.6 10.8 4.6 6.4 8.0 35.6 38.8 36.4 59.1 60.6 59.5
13.1 14.7 11.5 9.4 4.5 4.2 28.2 35.7 57.2 64.0
30.8 28.6 12.0 9.4 8.4 6.9 15.7 18.0 66.9 62.9 124.1 126.9
FROZEN FILLETS
USA
Mexico
Iran (Islamic Rep. of)
Other countries
Subtotal
Total 130.1
38.9 40.3 37.1 12.8 9.4 9.8 1.3 4.3 5.0 18.0 16.4 16.8 71.1 70.4 68.8 131.0 128.3
  thousand tonnes
thousand tonnes
2 480 2 400 2 320 2 240
2017 2 160
United Kingdom
1 600 1 200 800 400 0
2015 2016
Norway Chile
         Other
countries
Total production (right axis)
 Source: FAO (until 2015), Estimate (2016 & 2017)
 Source: NMFS
market is being observed in the EU market, although
prices remain weak. In contrast, the markets in Asia and Latin America continue to exhibit strong growth as more production enters domestic markets, supplemented by imports from China. In order to offset the declining interest from US buyers, Chinese companies are also increasingly seeking opportunities for expansion in Africa, as well as taking advantage of the strong and growing demand for tilapia in the Chinese domestic market. Overall, considering the current demand situation in the major markets, imports are not expected to increase substantially in the near future nor should a significant price increase be expected despite firm demand in Asia, Latin America and Africa.
SEABASS AND SEABREAM
Total farmed seabass and seabream production is expected to grow a further 5 to 7 percent in 2018, and all industry participants will be mindful of the potential impact that this continued growth will have on price levels, which have already been negatively affected by supply growth. That said, it must be recognized that there are a number of positive developments in production, processing, logistics and marketing that will help to boost company margins through demand generation and cost savings. There
have also been improvements in the economic outlook
for a number of key markets, and a sustained increase in prices for some competing seafood items such as salmon. Together, these developments represent an improved long-term outlook for the sector, but for 2018, it is still not clear that the positive effects will outweigh the downward pressure on prices resulting from continued supply growth.
Table 6. Chilean exports of salmon (by product and destination)
   2013
44.3 27.6 0.2 4.7 76.8
Japan
USA
Russian Federation
Other countries
Subtotal 150.9 Total 227.7
2014 2015 2016 2017
Jan-June (thousand tonnes)
49.3 50.2 52.9 48.8 35.8 40.4 34.0 35.0 0.9 1.8 4.3 4.0 5.7 6.3 6.1 6.3 91.8 98.7 97.4 94.0
54.5 51.3 44.1 44.3 16.6 14.8 18.2 16.6 13.8 23.5 21.3 14.6 64.4 58.6 68.5 51.3
149.3 148.1 152.2 126.8 241.2 246.8 249.6 220.8
  FROZEN WHOLE
      USA
Brazil
China
Other countries Subtotal
FROZEN FILLETS
65.4 13.8 15.6 56.0
 Source: Chile customs
(small shares of product type like salted not included)
     64
FOOD OUTLOOK NOVEMBER 2017
Market assessments
