
Page 2 - Data Visualization aligned
P. 2
Data Visualization
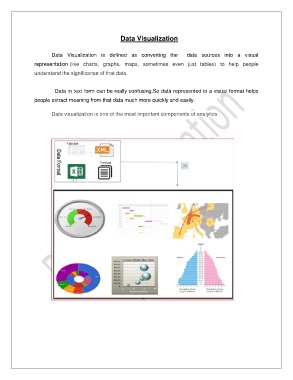
Data Visualization is defined as converting the data sources into a visual
representation (like charts, graphs, maps, sometimes even just tables) to help people
understand the significance of that data.
Data in text form can be really confusing.So data represented in a visual format helps
people extract meaning from that data much more quickly and easily.
Data visualization is one of the most important components of analytics