
Page 438 - House of Maxell
P. 438
418 Chapter 8
8.4.3 Filter Phase Characteristics. Time Delay
The phase specification typically encompasses the linearity of phase characteristic (),
constancy of group (− () ) or phase (− () ) delay. The phased delay represents
⁄
⁄
the absolute delay, and is of little significance while the group delay is one of the most critical
parameters not only in a filter but also in the whole RF system design. This is determined by
the fact that the group delay indicates the time needed for a signal of certain frequency to
propagate through a filter. If so, the not constant group delay means dispersive filter that might
manifests itself in phase misalignment between signal spectrum frequencies or quite severe
damage of signal envelope like more overshoot and ringing as well as pulse widening.
Fundamentally, the control of group delay dispersion is mandatory in most types of radars,
digital communication systems and especially in optical fiber links, characterized by extremely
high bit-rates and long distances.
To estimate the behavior of group delay in minimum phase circuits let us turn to the K-K
relation (2.111). Using the fact that = − , the integral defining the group delay can
⁄
⁄
be rewritten as
1 ∞ |()|
⁄
�
() = ∫ (8.8)
−∞ |()|(−)
The integrand in (8.8) demonstrates that the group delay depends on the transfer function ()
smoothness, i.e. higher magnitude variation rate |()| means more oscillation in phase
⁄
characteristic and extra group delay ()/. For example, the more abrupt transition from
passband to stopband as well as more ripples in passband means greater delay distortion. The
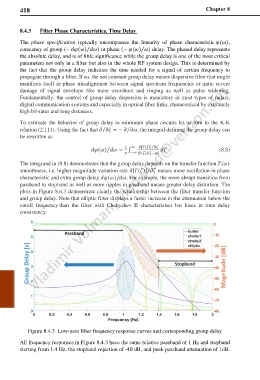
plots in Figure 8.4.3 demonstrate clearly the relationship between the filter transfer function
and group delay. Note that elliptic filter displays a faster increase in the attenuation below the
cutoff frequency than the filter with Chebyshev II characteristics but loses in time delay
consistency.
Figure 8.4.3 Low-pass filter frequency response curves and corresponding group delay
All frequency responses in Figure 8.4.3 have the same relative passband of 1 Hz and stopband
starting from 1.4 Hz, the stopband rejection of -40 dB, and peak passband attenuation of 1dB.