
Page 9 - BuTech - Technical information
P. 9
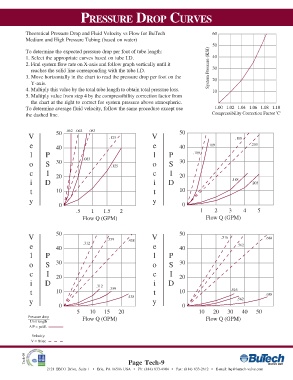
PRESSURE DROP CURVES

                   Theoretical Pressure Drop and Fluid Velocity vs Flow for BuTech               60
                   Medium and High Pressure Tubing (based on water)
                                                                                                 50
                   To determine the expected pressure drop per foot of tube length:
                   1. Select the appropriate curves based on tube I.D.                           40
                   2. Find system flow rate on X-axis and follow graph vertically until it
                     reaches the solid line corresponding with the tube I.D.                   System Pressure (KSI)  30
                   3. Move horizontally in the chart to read the pressure drop per foot on the   20
                     Y-axis.
                   4. Multiply this value by the total tube length to obtain total pressure loss.  10
                   5. Multiply value from step 4 by the compressibility correction factor from
                     the chart at the right to correct for system pressure above atmospheric.
                   To determine average fluid velocity, follow the same procedure except use      1.00  1.02 1.04 1.06 1.08 1.10
                   the dashed line.                                                              Compressibility Correction Factor 'C'


                                    .062 .062  .083
                                50                                                 50
                    V                                 .125              V                                  .188
                     e          40                                      e          40          .109              .203
                                                                                               .109
                     l     P                                            l      P         .109
                                           .083                                    30
                    o      S    30                     .125             o      S
                     c      I                                           c      I
                                20                                                 20
                     i     D                                            i      D                         .188    .203

                     t          10                                      t          10
                    y                                                   y
                                 0                                                  0
                                        .5    1    1.5    2                                 1     2     3     4     5
                                           Flow Q (GPM)                                       Flow Q (GPM)


                                50                                                 50
                    V                                .359               V                            .516              .688
                                           .312               .438
                     e          40                                      e          40                      .562
                     l     P                                            l      P

                    o      S    30                                      o      S   30
                     c      I                                           c      I
                                20                                                 20
                     i     D                                            i      D
                                                .312
                                                      .359                                               .516
                     t          10                                      t          10                                  .688
                                                              .438                                         .562
                    y                                                   y
                                 0                                                  0
                                        5     10    15    20                               10    20    30    40    50
                    Pressure drop          Flow Q (GPM)                                       Flow Q (GPM)
                     Unit length
                       P = psi/ft

                     Velocity:
                     V = ft/sec

                   Tech-09                                    Page Tech-9


                            2121 EBCO Drive, Suite 1  •  Erie, PA 16506 USA  •  Ph: (814) 833-4904  •  Fax: (814) 833-2612  •  E-mail: hq@butech-valve.com