
Page 6 - Apollo - Flanged Series Y-Strainers
P. 6
FLANGED SERIES Y-STRAINERS
ENGINEERING DATA Screen Correction Factor Chart
FOR NON-STANDARD AND MESH LINED SCREENS
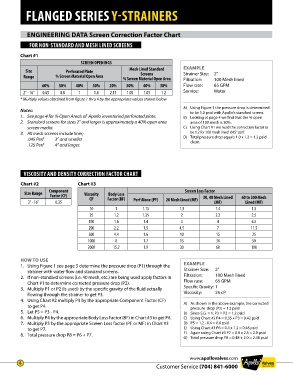
Chart #1
SCREEN OPENINGS
Size Perforated Plate Mesh Lined Standard EXAMPLE
Screens
Range % Screen Material Open Area % Screen Material Open Area Strainer Size: 2”
100 Mesh lined
Filtration:
60% 50% 40% 30% 20% 50% 40% 30% Flow rate: 65 GPM
2" - 16" 0.65 0.8 1 1.4 2.15 1.05 1.05 1.2 Service: Water
* Multiply values obtained from figure 1 thru 4 by the appropriate values shown below
A) Using Figure 1 the pressure drop is determined
Notes: to be 1.0 psid with Apollo’s standard screen.
1. See page 4 for % Open Area’s of Apollo inventoried perforated plate. B) Looking at page 4 we find that the % open
2. Standard screens for sizes 2” and larger is approximately a 40% open area area of 100 mesh is 30%.
screen media. C) Using Chart #1 we read the correction factor to
3. All mesh screens include liner; be 1.2 for 100 mesh lined .045” perf.
.045 Perf 3” and smaller D) Total pressure drop equals 1.0 x 1.2 = 1.2 psid
clean.
.125 Perf 4” and larger.
VISCOSITY AND DENSITY CORRECTION FACTOR CHART
Chart #2 Chart #3
Component Screen Loss Factor
Size Range Viscosity Body Loss
Factor (CF) 30, 40 Mesh Lined 60 to 300 Mesh
2” - 16” 0.35 CP Factor (BF) Perf Alone (PF) 20 Mesh Lined (MF) (MF) Lined (MF)
10 1 1.15 1.3 1.4 1.5
25 1.2 1.25 2 2.2 2.5
100 1.6 1.4 3 4 6.5
200 2.2 1.5 4.5 7 11.5
500 4.4 1.6 10 15 25
1000 8 1.7 15 30 50
2000 15.2 1.9 30 60 100
HOW TO USE
1. Using Figure 1 see page 5 determine the pressure drop (P1) through the EXAMPLE
strainer with water flow and standard screens. Strainer Size: 2”
2. If non-standard screens (i.e. 40 mesh, etc.) are being used apply factors in Filtration: 100 Mesh lined
Chart #1 to determine corrected pressure drop (P2). Flow rate: 65 GPM
3. Multiply P1 or P2 (is used) by the specific gravity of the fluid actually Specific Gravity: 1
flowing through the strainer to get P3. Viscosity: 25 cP
4. Using Chart #2 multiply P3 by the appropriate Component Factor (CF)
to get P4. A) As shown in the above example, the corrected
pressure drop (P2) = 1.2 psid
5. Let P5 = P3 - P4. B) Since S.G. = 1, P3 = P2 = 1.2 psid
6. Multiply P4 by the appropriate Body Loss Factor (BF) in Chart #3 to get P6. C) Using Chart #2 P4 = 0.35 x P3 = 0.42 psid
7. Multiply P5 by the appropriate Screen Loss factor (PF or MF) in Chart #3 D) P5 = 1.2 - 0.4 = 0.8 psid
to get P7. E) Using Chart #3 P6 = 0.4 x 1.2 = 0.48 psid
8. Total pressure drop P8 = P6 + P7. F) Again using Chart #3 P7 = 0.8 x 2.5 = 2.0 psid
G) Total pressure drop P8 = 0.48 + 2.0 = 2.48 psid
www.apollovalves.com
6
Customer Service (704) 841-6000