
Page 31 - Shroeder - Filter Systems
P. 31
Why Contamination Control is Important
■ The core aspects of contamination management are a cost analysis and efficiency review. Economic
The following costs are considered in the cost analysis:
Efficiency
■ Warranty and non-warranty courtesy work
Analysis
■ Energy costs (e.g. cooling and reheating of washing machines during fluid changes)
■ Test stand costs (test item time)
■ Costs of the tools and dies of machine tools (increased wear due to high particle concentrations)
■ Fluid costs (washing machines, test stations, machine tools)
■ Labor costs (reworking, cleaning of washing machines, machine tools, etc.)
■ Filter costs
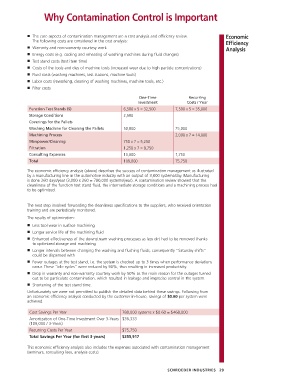
One-Time Recurring
Investment Costs / Year
Function Test Stands (5) 6,500 x 5 = 32,500 7,500 x 5 = 35,000
Storage Conditions 2,500
Coverings for the Pallets
Washing Machine for Cleaning the Pallets 50,000 25,000
Machining Process 2,000 x 7 = 14,000
Manpower/Cleaning 750 x 7 = 5,250
Filtration 1,250 x 7 = 8,750
Consulting Expenses 10,000 1,750
Total 109,000 75,750
The economic efficiency analysis (above) describes the success of contamination management as illustrated
by a manufacturing line in the automotive industry with an output of 3,000 systems/day. Manufacturing
is done 260 days/year (3,000 x 260 = 780,000 systems/year). A contamination review showed that the
cleanliness of the function test stand fluid, the intermediate storage conditions and a machining process had
to be optimized.
The next step involved forwarding the cleanliness specifications to the suppliers, who received orientation
training and are periodically monitored.
The results of optimization:
■ Less tool wear in surface machining
■ Longer service life of the machining fluid
■ Enhanced effectiveness of the downstream washing processes as less dirt had to be removed thanks
to optimized storage and machining
■ Longer intervals between changing the washing and flushing fluids, consequently “Saturday shifts”
could be dispensed with
■ Fewer outages at the test stand, i.e. the system is checked up to 3 times when performance deviations
occur. These “idle cycles” were reduced by 90%, thus resulting in increased productivity.
■ Drop in warranty and non-warranty courtesy work by 50% as the main reason for the outages turned
out to be particulate contamination, which resulted in leakage and imprecise control in the system.
■ Shortening of the test stand time.
Unfortunately we were not permitted to publish the detailed data behind these savings. Following from
an economic efficiency analysis conducted by the customer in-house, savings of $0.60 per system were
achieved.
Cost Savings Per Year 780,000 systems x $0.60 = $468,000
Amortization of One-Time Investment Over 3-Years $36,333
(109,000 / 3-Years)
Recurring Costs Per Year $75,750
Total Savings Per Year (for first 3-years) $355,917
This economic efficiency analysis also includes the expenses associated with contamination management
(seminars, consulting fees, analysis costs).
SCHROEDER INDUSTRIES 29