
Page 29 - Shroeder - Filter Systems
P. 29
Functional Testing
Most systems come into contact with the Function
hydraulic fluid during initial system filling Testing
or function testing. This process affords the
manufacturer a substantial opportunity to
impact the final cleanliness of the entire system.
By using suitable filtration of the filling and
test fluids, system cleanliness can be quickly
optimized upon delivery or commissioning.
The cleanliness of the final product can be
controlled via function testing in the same
way as by a washing machine. Some companies
have the following motto: “The test stand is
our last washing machine.”
This statement might be true, however it is
an expensive approach in practice. Yet when
performing process reliability measures for
supplying systems with a defined cleanliness,
Figure 28. Schematic illustrates the basic setup of this is the first approach.
most test stands
On a function test stand not only function
testing is performed but the components and systems are run in as well. A frequent side effect of this is the
flushing effect of the system undergoing testing. By employing targeted fluid maintenance and cleanliness
monitoring, this flushing effect can be used to ensure that systems possess a defined, constant cleanliness
status upon delivery.
Cleanliness monitoring provides information on the process stability of the upstream fabrication and
cleaning steps. Frequently, continuous monitoring of test fluid cleanliness results in the cleanliness of the
entire system as supplied being documented. This approach is used in mobile hydraulics, turbines or paper
machinery upon delivery or during commissioning in order to demonstrate to the final customer that his
system is being supplied with the specified cleanliness.
Example: The following study illustrates the cleaning process of a pump during commissioning:
The cleanliness of the test fluid upstream of the test item is maintained at a cleanliness rating of 16 / 14 /
11 (c). After 5 minutes of testing the pump speed is briefly increased to the maximum speed. The test run is
concluded after 10 minutes.
In this case, the dirt content of the test item amounted to 1 mg/kg component weight upon the conclusion
of the test run.
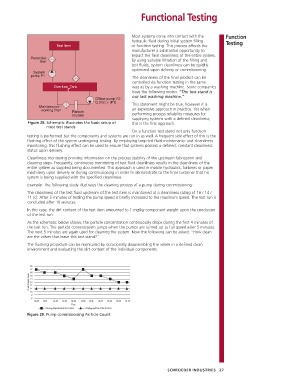
As the schematic below shows, the particle con cen tration continuously drops during the first 4 minutes of
the test run. The particle concentration jumps when the pumps are turned up to full speed after 5 minutes.
The next 5 minutes are again used for cleaning the system. Now the following can be asked: “How clean
are the valves that leave this test stand?”
The flushing procedure can be monitored by occasionally disassembling the valves in a defined clean
environment and evaluating the dirt content of the individual components.
Figure 29. Pump commissioning Particle Count
SCHROEDER INDUSTRIES 27