
Page 5 - Proportion-Air - F-series Electro-Pneumatic Flow Monitor
P. 5
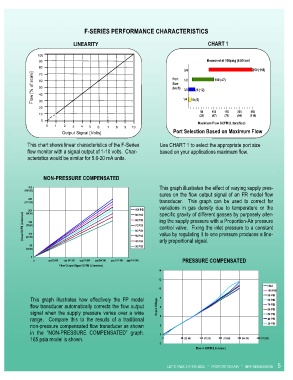
F-SERIES PERFORMANCE CHARACTERISTICS


                                LINEARITY                                               CHART 1
                 100
                 90                                                                    Measured at 100psig (6.89 bar)
                 80                                                           3/4                          250 (118)
                 70
               Flow [% of scale]   60                                    Port  1/2  25 (12)  100 (47)

                 50
                                                                         Size
                                                                         (inch)
                 40
                                                                              3/8
                 30
                 20                                                           1/4  10 (5)
                 10                                                                  50   100   150   200   250
                  0                                                                 (24)  (47)   (71)  (94)  (118)
                    0   1   2   3   4   5   6   7   8   9  10                       Maximum Flow SCFM (Liters/Sec)

                           Output Signal [Volts]                         Port Selection Based on Maximum Flow

             This chart shows linear characteristics of the F-Series   Use CHART 1 to select the appropriate port size
             flow monitor with a signal output of 1-10 volts.  Char-  based on your applications maximum flow.
             acteristics would be similar for 5.6-20 mA units.


                   NON-PRESSURE COMPENSATED
             300                                                    This graph illustrates the effect of varying supply pres-
           (141.58)
                                                                    sures on the flow output signal of an FR model flow
             250
           (117.99)                                                 transducer.  This graph can be used to correct for
                                                                    variations in gas density due to temperature or the
             200                                          100 PSI   specific gravity of different gasses by purposely alter-
           Actual SCFM (Liters/sec)  (70.80)              80 PSI    ing the supply pressure with a Proportion-Air pressure
            (94.39)
                                                          90 PSI
             150
                                                          70 PSI
                                                                    control valve.  Fixing the inlet pressure to a constant
                                                          60 PSI
                                                                    value by regulating it to one pressure produces a line-
             100
                                                          50 PSI
            (47.20)
             50                                           40 PSI    arly proportional signal.
                                                          30 PSI
            (23.60)
              0
               0     50 (23.60)  100 (47.20)  150 (70.80)  200 (94.39)  250 (117.99)  300 (141.58)  PRESSURE COMPENSATED
                          Flow Output Signal SCFM (Liters/sec)
                                                                   14
                                                                   12
                                                                                                                 Ideal
                                                                   10
                                                                                                                 100 PSI
                                                                                                                 90 PSI
              This graph illustrates  how effectively the FP model   8                                           80 PSI
              flow transducer automatically corrects the flow output   Output Voltage  6                         70 PSI
                                                                                                                 60 PSI
              signal when the supply pressure varies over a wide    4                                            50 PSI
              range.  Compare this to the results of a traditional                                               40 PSI
              non-pressure compensated flow transducer as shown     2                                            30 PSI
              in the “NON-PRESSURE COMPENSATED” graph.              0
              165 psia model is shown.                               0       50 (23.60)  100 (47.20)  150 (70.80)  200 (94.39)  250 (117.99)
                                                                    -2
                                                                                   Flow in SCFM (Liters/sec)


                                                                       LET’S TALK 317-335-2602   *   PROPORTION-AIR   *   BRF-SERIES0405E   5