
Page 3 - Parker - TruBind 300 Cartridges
P. 3
TruBind 300 Findings
Removal performance
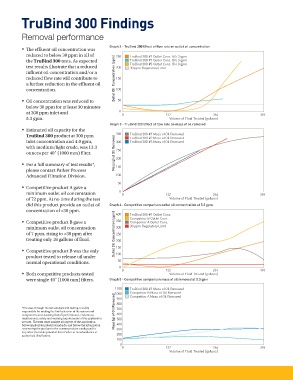
Graph 2 - TruBind 300 Effect of fl ow rate on outlet oil concentration
• Th e effl uent oil concentration was
reduced to below 30 ppm in all of 250 TruBind 300 #1 Outlet Conc. @ 5.3 gpm
the TruBind 300 tests. As expected TruBind 300 #2 Outlet Conc. @ 5.3 gpm
TruBind 300 #3 Outlet Conc. @ 4.0 gpm
test results illustrate that a reduced 200 30 ppm Regulatory Limit
infl uent oil concentration and/or a
reduced fl ow rate will contribute to Outlet Oil Concentration (ppm) 150
a further reduction in the effl uent oil
concentration. 100
• Oil concentration was reduced to 50
below 30 ppm for at least 30 minutes
at 300 ppm inlet and 0
0 132 264 396
5.3 gpm. Volume of Fluid Treated (gallons)
Graph 3 - TruBind 300 Effect of fl ow rate on mass of oil removed
• Estimated oil capacity for the
350 TruBind 300 #1 Mass of Oil Removed
TruBind 300 product at 300 ppm TruBind 300 #2 Mass of Oil Removed
inlet concentration and 4.0 gpm, 300 TruBind 300 #3 Mass of Oil Removed
with medium/light crude, was 13.3 250
ounces per 40" (1000 mm) fi lter. Mass (g) of Oil Removed 200
• For a full summary of test results*, 150
please contact Parker Process
Advanced Filtration Division. 100
50
• Competitive product A gave a
0
minimum outlet oil concentration 0 132 264 396
of 72 ppm. At no time during the test Volume of Fluid Treated (gallons)
did this product provide an outlet oil Graph 4 - Competitive comparison outlet oil concentration at 5.3 gpm
concentration of <30 ppm. 400 TruBind 300 #1 Outlet Conc.
• Competitive product B gave a 350 Competitor B Outlet Conc.
Competitor A Outlet Conc.
minimum outlet oil concentration 300 30 ppm Regulatory Limit
of 7 ppm, rising to >30 ppm after Outlet Oil Concentration (ppm) 250
treating only 18 gallons of fl uid. 200
• Competitive product B was the only 150
100
product tested to release oil under
50
normal operational conditions.
0
0 132 264 396
• Both competitive products tested Volume of Fluid Treated (gallons)
were single 40" (1000 mm) fi lters. Graph 5 - Competitive comparison mass of oil removed at 5.3 gpm
1100 TruBind 300 #1 Mass of Oil Removed
1000 Competitor B Mass of Oil Removed
Mass (g) of Oil Removed
Competitor A Mass of Oil Removed
900
*Th e user, through its own analysis and testing, is solely 800
700
responsible for making the fi nal selection of the system and
components and assuring that all performance, endurance, 600
maintenance, safety and warning requirements of the application 500
are met. Th e user must analyze all aspects of the application,
follow applicable industry standards, and follow the information 400
concerning the product in the current product catalog and in 300
any other materials provided from Parker or its subsidiaries or
authorized distributors. 200
100
0
0 132 264 396
Volume of Fluid Treated (gallons)