
Page 13 - 2015 A2LA AnnualReport
P. 13
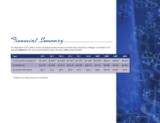
Financial Summary

A comparison of the total revenue and support plus investment income less expenses resulting in a change in net
assets (in $000s) for the years ended at December 31st since 2006 is shown below.

Year	                  2015	 2014	 2013	2012	2011	 2010	2009	2008	2007	2006

Total Revenue & Support *	 $15,628	 $14,422	 $13,424	 $12,487	 $11,225	 $11,005	 $10,338	 $9,074	 $8,599	 $8,780

Total Expense	         $15,151	$14,056	$13,017	$12,129	$10,999	$10,541	$9,749	$9,688	$8,746	$8,486

Change in Net Assets	  $477	              $366	  $407	 $358	 $226	  $464	 $589	 $(614)	 $(147)	 $294


* Includes investment income and losses.

                                                                                                                  2015 Annual Report 13