
Page 48 - CJO_W18
P. 48
C CLINICAL RESEARCH
be relatively mild and may include centrocecal scotomas, mild peripheral defects, generalized constriction or
altitudinal defects. 8,18,24 This characterization of insidious onset with slow, bilateral progression and prolonged
optic disc edema progressing to atrophy was first described by Macaluso et al., and later echoed by subsequent
reports, case series and reviews. 8,17,22,23 However, cases may deviate from this generalization and can present
with acute vision loss or unilateral optic neuropathy. Stabilization of the optic disc with resolution of edema
18
tends not to occur for several months, with a median 3 months, 2,18,23 even after the revocation of amiodarone.
Interestingly, the development of optic disc edema has been reported even weeks after the discontinuation of
amiodarone. Amiodarone in the blood may remain at therapeutic or near-therapeutic levels for extended pe-
18
riods due to its variable and long half-life, 18,26 averaging 58 but up to 142 days, and thus is thought to continue
27
to exert a toxic effect on the disc even after drug discontinuation. 14,28
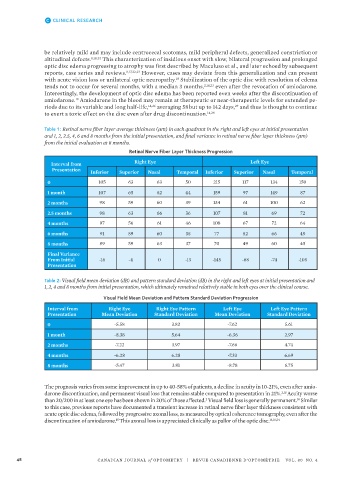
Table 1: Retinal nerve fiber layer average thickness (μm) in each quadrant in the right and left eyes at initial presentation
and 1, 2, 2.5, 4, 6 and 8 months from the initial presentation, and final variance in retinal nerve fiber layer thickness (μm)
from the initial evaluation at 8 months.
Retinal Nerve Fiber Layer Thickness Progression
Interval from Right Eye Left Eye
Presentation
Inferior Superior Nasal Temporal Inferior Superior Nasal Temporal
0 105 63 63 50 215 117 134 150
1 month 107 65 62 44 159 97 149 87
2 months 98 59 60 39 134 61 100 62
2.5 months 98 63 66 36 107 81 69 72
4 months 97 56 61 46 108 67 72 64
6 months 91 59 60 35 77 52 66 49
8 months 89 59 63 37 70 49 60 45
Final Variance
From Initial -16 -4 0 -13 -145 -68 -74 -105
Presentation
Table 2: Visual field mean deviation (dB) and pattern standard deviation (dB) in the right and left eyes at initial presentation and
1, 2, 4 and 8 months from initial presentation, which ultimately remained relatively stable in both eyes over the clinical course.
Visual Field Mean Deviation and Pattern Standard Deviation Progression
Interval from Right Eye Right Eye Pattern Left Eye Left Eye Pattern
Presentation Mean Deviation Standard Deviation Mean Deviation Standard Deviation
0 -5.58 3.82 -7.62 5.61
1 month -8.38 5.64 -6.36 2.97
2 months -7.22 3.97 -7.66 4.74
4 months -6.28 6.28 -7.33 6.69
8 months -5.47 3.81 -8.78 6.75
The prognosis varies from some improvement in up to 40-58%of patients, a decline in acuity in 10-21%, even after amio-
darone discontinuation, and permanent visual loss that remains stable compared to presentation in 21%. 2,18 Acuity worse
than 20/200 in at least one eye has been shown in 20% of those affected. Visual field loss is generally permanent. Similar
2
18
to this case, previous reports have documented a transient increase in retinal nerve fiber layer thickness consistent with
acute optic disc edema, followed by progressive axonal loss, as measured by optical coherence tomography, even after the
discontinuation of amiodarone. This axonal loss is appreciated clinically as pallor of the optic disc. 14,18,24
15
48 CANADIAN JOURNAL of OPTOMETRY | REVUE CANADIENNE D’OPTOMÉTRIE VOL. 80 NO. 4