Page 25 - YOROZU America Corp.
P. 25
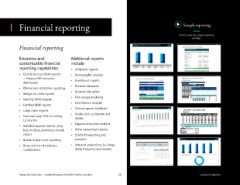
Financial reporting Sample reporting
Click to view the sample reporting
package.
Financial reporting Expected Accrual Assessment by Total Summary (Total Medical) Monthly Medical/Rx Projection
Self Funded Medical
Total Cost vs Expected Accrual
12-Month Renewal Projection
$46,500,000 $48,000,000 $44,000,000 Self Funded Medical - Status Quo Total Medical
$43,000,000 $42,000,000 $41,500,000 Projected Lives (Nov-19) PEPM 3,707 Total
Experience (Dec-18 - Nov-19)
Average Lagged Lives (1 Month) 3,772
Total Claims $833.66 $37,729,657
$843.71
$38,184,500
-$454,843
ISL Adjustments
-$10.05
Claims Net ISL Adjustments
Extensive and Additional reports 97% 102% 101% Annual Trend $892.01 7.0% 7.0% 0.0% 14 $40,370,733
Trending Months
Effective Trend
Trended Claims
Claim Fluctuation Corridor
customizable inancial include Total Medical Summary Lives Total Cost Jan-18 to Dec-18 Accrual Var ($) Jan-17 to Dec-17 % Projected Claims $892.01 1.0000 $40,370,733
Plan Design Adjustment
Jan-19 to Nov-19
$1,337,562
Administration Fees
$30.07
Stop Loss Fees
$11.13
$495,269
$0
$0.00
Estimated Rx Claims Savings
reporting capabilities • Utilization reports Jan-19 to Nov-19 103,819 $46,500,000 $48,000,000 ($1,000,000) 102% 97% Projected Cost $933.22 $42,203,564 1
$1,500,000
$43,000,000
$44,000,000
112,140
Jan-18 to Dec-18
$40,084,594
$901.15
Current Accrual
$42,000,000
111,429
$41,500,000
101%
($500,000)
Jan-17 to Dec-17
3.56%
% Change in Current Accrual
$39,593,962
Actual Cost
$890.12
-$490,632
-1.22%
Actual Cost vs. Current Accrual
10
• Cash & Accrual (C&A) reports • Demographic analysis
— Finance/HR executive • Enrollment reports Large claim distribution analysis Monthly Financial Reporting Sample
Medical /Rx
dashboards Large Claim Distribution - Annual Sample Client Month Paid Claim Payments are Valued as of: (ASO and Stop Loss Paid Claims Large Claims 1 Total Paid Net Claims = Fixed + Claims (Monthly) Expected Plan Costs 2 Total Plan Costs (Cumulative) Expected Plan Costs 2
Sample Client
Medical and Rx Cash Flow Summary - (By Month Paid)
I.
November 30, 2019
Total Plan Costs
Fixed Costs
IIa.
Enrolled
Subscribers
Adjustments
= Fixed +
• Network discounts Plan Year 2018 2019 Actuarial Norm - January-18 February-18 March-18 April-18 May-18 June-18 3,762 3,749 3,743 3,730 3,737 3,753 Premium) $141,756 $141,228 $140,998 $140,651 $141,010 $141,575 $2,408,184 $2,350,989 $2,734,267 $2,430,645 $3,188,961 $2,838,492 $37,593 $253 Sample Self Funded Claim Report - Medical $2,512,347 $5,004,311 $7,879,575 $10,450,871 $13,780,842 $16,741,064 Claims $2,798,615 $5,585,742 $8,372,206 $11,156,468 $13,948,781 $16,751,884
$2,798,615
$2,370,591
$2,512,347
$2,491,964
$2,787,127
$2,350,736
$0
$2,734,267
$2,786,464
$2,875,265
$2,784,263
$2,571,296
$0
$2,430,645
$3,188,961
• Clinical and utilization reporting Average Employees Count 18,612 Average Cost Count 19,525 Average Cost Count 19,525 Average Cost Cumulative (1/1/2018-18) 3,726 3,760 3,745 3,714 3,695 3,742 44,856 3,806 $140,651 $141,999 $141,493 $140,420 $139,583 $141,357 $1,692,721 $140,822 $2,625,621 $3,605,400 $2,549,164 $3,398,331 $2,314,924 $3,188,907 $33,633,884 $2,970,669 $738 Plan Year Ending 12/31/19 Members Total 5,747 5,784 $34,384,213 $2,765,534 $3,525,080 $2,650,996 $3,047,477 $2,414,380 Admin Fee $3,239,682 $107,634 $108,437 $3,111,491 Specific Stop- $3
$2,792,313
Expected Annual
$0
$3,329,971
$2,803,103
$2,960,222
$2,818,647
$19,845
$2,624,883
$2,785,631
July-18
Average Members
$2,810,564
August-18
$222,319
$3,383,081
$39,661
$2,803,528
$2,509,503
September-18
10,635
10,635
$2,907,057
$491,274
October-18
10,007
$2,761,428
$2,781,392 Total Fixed
Total Sub-
November-18
$2,274,797
Month/Year
$40,127
Claims
scribers
Loss Premium
($450k)
December-18
$33,490,389
$90,583
Frequency/Severity
$3,098,325
$2,795,963
$33,490,389
Jan-19
$32,691,492
3,806
$942,392
$0
$3,205,023 $141,856
3,834
$0 Feb-19
$0
January-19
$2,970,669
$3,205,023
• Network disruption $125k - $150k 30 22 13 11 $135,913 22 15 20 13 $134,996 24.8 17.0 11.2 14.8 $136,788 IIb. February-19 March-19 April-19 May-19 June-19 July-19 August-19 3,834 3,828 3,805 3,834 3,826 3,753 3,748 $141,856 $141,738 $140,848 $141,863 $141,598 $138,911 $138,830 $2,596,009 $2,723,194 $2,773,443 $3,604,519 $2,579,242 $2,954,615 $3,363,539 $2,741 Jul-19 $440 Aug-19 $40,121 Sep-19 $0 Mar-19 $0 Apr-19 $0 May-19 $0 Jun-19 $2,596,009 $2,723,194 $2,773,443 $3,604,519 $2,576,501 $2,954,176 $3,323,418 3,828 3,805 3,834 3,826 3,753 3,
$162,430
$3,231,924 $140,848
$161,632
$159,440
$150k - $175k
$3,211,094 $141,863
$186,198
$3,231,374 $141,598
$187,746
$175k - $200k
$186,695
$3,225,183 $138,911
$3,161,773 $138,830
$200k - $250k
$222,856
$222,076
$213,335
• Budget vs. claim reports Membership Adjusted 90.3 22 98 $496,851 37 107 94.7 $273,870 27.0 94.7 $439,674 Cumulative (1/1/2019-19) 3,696 3,690 3,707 41,528 $136,895 $136,718 $137,415 $1,537,496 $2,730,685 $3,139,786 $3,297,017 $32,732,717 ($3,074) v - 19 $219,239 $259,468 Average/Month No Dec-19 $32,473,249 $2,730,685 $3,142,859 $3,077,777 3,690 3,707 41,528 3,775 41,563 0 62,914 62,951 5,613 5,643 0 5,719 $1,174,401 $34,010,745 $104,342 $2,867,580 $3,279,578 $104,828 $3,215,192 $106,764 $28.30 $0 $32,376 $32,587 $363,095 $33,009 $0 $8.72 $3,1
$3,164,750 $136,895
$250k+
$468,150
$0 Oct-19
September-19
October-19
$3,118,977 $137,415
Grand Totals
$3,138,444
$238,459
November-19
$246,780
December-19
YTD Totals
$246,780
$246,780
$35,037,333 $139,772
Average/PEPM
Norms
Current Policy Year To Date
Lagged Lives
• Plan design modeling # of Claimants > $100k per $23,369,000 $29,304,000 $23,373,000 III. Rolling 12 Months Actual vs Expected (Dec-18 to Nov-19) $93,126,066 $94,583,239 98% IV. Actual Plan Cost $4,000,000 $3,500,000 $3,000,000 $2,500,000 $2,000,000 Cautiously Optimistic $34,010,745 $35,037,333 97% V. Ind Stop Loss (ISL) Deductible Per Claimant $500,000 $259,468 Employee Contributions Sample Net Plan PEPM Comparison 96.4% $825 $856
(Paid Basis)
5.3
Current Policy Year Stop Loss Summary
5.5
4.9
1,000 Members
(based on lagged enrollment)
Rolling Twelve Actual Plan Costs
Large Claims Adjustments
Rolling Twelve Expected Plan Costs
Expected Plan Costs
Total Large Claims >$125k
Percent of Expected
Percent of Expected
2019 YTD Actual
2019 YTD Budget
• Monthly IBNR analysis PEPM Large Claims $195 $230 $183 1 $1,500,000 $1,000,000 $500,000 $0 Jan-19 Feb-19 Mar-19 Apr-19 May-19 Jun-19 Jul-19 Aug-19 Sep-19 Oct-19 Nov-19 Dec-19 Cost Total Accrual 2018 Actual 104.0% 12.6% $780 $750 6.5% 5
Actual vs. Budget
2018 Budget
Actual vs. Budget
2019 vs. 2018 Actual
2019 vs. 2018 Budget
• Contribution analysis
• Certiied IBNR reports Claims Trending
• Clinical reports (Infolock) Self Funded Medical Self Insured Claim Report Sample
• Large claim reports PEPM Claims by Policy Period Quarter PEPM Claims $710 $730 12-Month Average $780 $730 $790 $790 Medical/Rx
$900
$800
• Onsite clinic utilization and $700 $600 $500 $650 $680 Month/Year Subscribers Members Admin Fee Specific Stop- Total Fixed Gross Medical Gross Rx Claims Reimbursable Net Paid Claims Total Net
Stop-Loss
Total
Total
Plan Cost
Loss
Claims
Premium
Claims ($175k)
• Year-over-year (YOY) or rolling claims $400 $300 $200 $100 $65 Mar-19 2,405 2,384 2,393 2,392 2,391 5,471 5,423 5,424 5,445 5,419 $93,362 $226,671 $320,033 $2,254,931 $724,894 $20,317 $0 $2,979,824 $3,299,858
Jan-19
$317,239
Feb-19
$703,886
$3,005,297
$92,547
$224,692
$2,688,058
$2,004,489
$2,146,731
$3,241,591
$225,540
$318,437
$92,896
$777,111
$688
$2,923,154
$92,857
$386,407
$855,677
$3,266,494
$225,446
$318,303
Apr-19
$2,948,190
$2,478,921
May-19
$3,252,934
$2,934,763
$318,170
$2,257,775
$92,819
$225,352
$898,619
$221,631
Jun-19
$0
12 months PEPM COST VS ACCRUAL 1Q17 2Q17 3Q17 4Q17 1Q18 2Q18 3Q18 4Q18 1Q19 2Q19 3Q19 4Q19 Aug-19 2,384 2,396 2,382 2,393 2,430 2,422 5,406 5,456 5,421 5,442 5,492 5,468 $92,547 $224,692 $317,239 $2,216,474 $876,056 $667,899 $2,424,631 $2,741,870
$225,823
Jul-19
$2,903,452
$93,013
$2,090,771
$318,836
$388,500
$882,345
$2,584,616
$884,324
$2,544,848
$469,760
$316,973
$224,504
$92,469
$2,959,412
$3,276,385
$381,438
$3,437,396
$92,896
$3,118,959
$870,380
$318,437
$225,540
Sep-19
$2,630,017
$94,333
$939,423
Oct-19
$2,480,808
$1,988,416
$323,360
$447,031
$2,804,168
$229,028
Nov-19
$1,807,660
$322,296
$821,998
$94,022
$228,274
$84,968
$2,544,691
$2,866,986
• Expense allocation analysis $1,000 $900 $800 Cost Accrual YTD Totals 2,419 28,791 5,460 65,327 $1,117,667 $2,713,552 $3,831,218 $27,031,348 $10,139,645 $3,710,042 $33,460,951 $37,292,169
$2,873,843
$641,403
$3,195,739
$321,896
Dec-19
$227,991
$93,906
$904,933
$2,610,313
• Detailed expense (admin., stop- $700 $600 $500 $400 PEPM Comparison 2,399 28,668 5,444 65,051 $93,139 $226,129 $319,268.20 $2,252,612 $844,970 $309,170 $2,788,413 $3,107,681
Average/Month
$129.41
$94.25
Average/PEPM
$1,167.19
$38.82
$942.91
$1,300.26
$353.69
$133.07
Lagged Lives
loss, medical, pharmacy, dental, • Other customized reports $300 $200 $100 $0 YTD Total PEPM (based on lagged enrollment) $1,300.26
2018 Total PEPM
$1,249.35
2019 vs. 2018 Change
4.1%
2019 Budget PEPM $1,392.08 6
2019 Actual vs. Budget
-6.6%
vision) • COVID-19 reporting and 8
• Global or plan level reporting analytics Executive Overview
Self Funded Medical
PEPM Cost vs Accrual
$879.33
$843.25
$842.75 $817.89 $832.28 $843.65 $846.01
$765.31
$780.11 $747.79
• Gross and net of employee • Actuarial projections, i.e., large
contributions claim frequency and severity
104% 91% 97% 99% 104%
4Q18 1Q19 2Q19 3Q19 4Q19
Policy Period Claims by Band $250,000 - $449,999 $450,000+ 4.1%
5.1%
$150,000 - $249,999
7.0%
<$150,000
LOCKTON COMPANIES | 1 83.8%
7
Yorozu America Corp. — Lockton Employee Beneits Practice overview 25 Lockton Companies