
Page 198 - GM E-BOOKLET 2022
P. 198
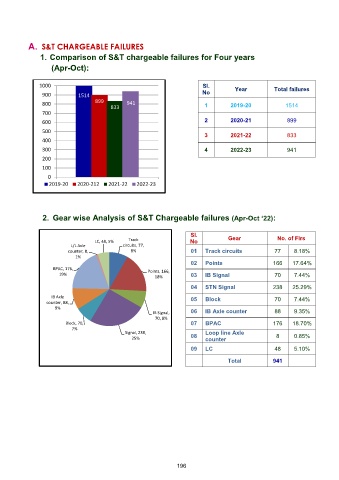
A. S&T CHARGEABLE FAILURES

               1. Comparison of S&T chargeable failures for Four years
                   (Apr-Oct):


               1000                                                     Sl.         Year         Total failures
                900          1514                                       No
                800               899         941                        1        2019-20            1514
                                        833
                700
                600                                                      2        2020-21             899
                500
                                                                         3        2021-22             833
                400
                300                                                      4        2022-23             941
                200
                100
                  0
                  2019-20   2020-212   2021-22   2022-23


                2. Gear wise Analysis of S&T Chargeable failures (Apr-Oct ‘22):


                                                                    Sl.          Gear             No. of Flrs
                                  LC, 48, 5%  Track                 No
                          L/L Axle          circuits, 77,
                         counter, 8,           8%                   01   Track circuits          77     8.18%
                            1%
                                                                    02   Points                  166    17.64%
                    BPAC, 176,                       Points, 166,
                      19%                              18%          03   IB Signal               70     7.44%
                                                                    04   STN Signal              238    25.29%
                   IB Axle                                          05   Block                   70     7.44%
                 counter, 88,
                    9%
                                                       IB Signal,   06   IB Axle counter         88     9.35%
                                                       70, 8%
                        Block, 70,                                  07   BPAC                    176    18.70%
                          7%
                                             Signal, 238,                Loop line Axle
                                               25%                  08   counter                  8     0.85%
                                                                    09   LC                      48     5.10%
                                                                                 Total           941


                                                               196