
Page 197 - classs 6 a_Neat
P. 197
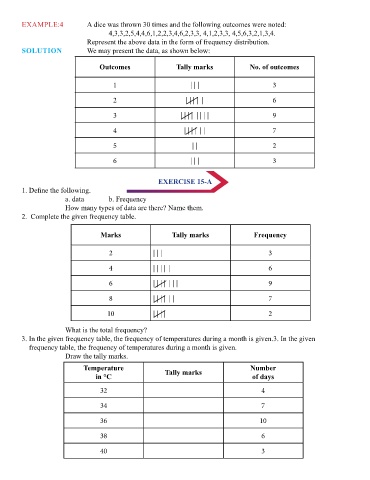
EXAMPLE:4             A dice was thrown 30 times and the following outcomes were noted:
                                     4,3,3,2,5,4,4,6,1,2,2,3,4,6,2,3,3, 4,1,2,3,3, 4,5,6,3,2,1,3,4.
 14  Data Handling            Represent the above data in the form of frequency distribution.
        SOLUTION              We may present the data, as shown below:


                                  Outcomes                 Tally marks              No. of outcomes
 DATA    The word data means iriformation in the form of numerical figures.
 EXAMPIE:1    The marks obtained by 10 pupils of a class in a monthly test are given below:  1  | | |   3
          37, 21, 43, 16, 25, 21, 28, 32, 45, 14.
          We call it the data related to the marks obtained by 10 pupils of a class in a monthly       2  | | | |  |  6
 test.
 EXAMPLE:2    The ages (in years) ofl2 teachers in a school are:  3  | | | |  | | | |      9
 35,43,38,45,32,54,39,43,39,54,24,31.  4                      | | | |  | |                 7
          We call it the data related to the ages ofl2 teachers in a school.
 RAW DATA      Data obtained in the original form is called raw data.    5  | |            2
          Data given in the above examples are raw data.
 ARRAY       Arranging the numerical figures in an ascending or a descending order is called  6  | | |  3
 an array.
                                                     EXERCISE 15-A
 TABULATION OF DATA Arranging the data in a systematic form in the form of a table is called tabulation or   1. Define the following.
 presentation of the data.  a. data    b. Frequency
                       How many types of data are there? Name them.
 OBSERVATIONS Each numerical figure in a data is called an observation.  2.  Complete the given frequency table.

 FREQUENCY OF AN OBSERVATION The number of times a particular observation occurs is called its   Marks  Tally marks  Frequency
 frequency.
                                     2              | | |                                 3
 STATISTICS It is the science which deals with the collection, presentation, analysis and interpretation of nu-
 merical data.                       4              | | | |  |                            6


 ILLUSTRATIVE EXAMPLES               6              | | | |  | | |                        9
                                     8              | | | |  | |                          7
 Example:3   Given below is the data showing the number of children in 20families of a colony:
          2, 1, 3, 1, 2, 1, 1, 3, 2, 3, 2, 3, 2, 2, 4, 3, 1, 4, 3, 2.  10  | | | |        2
 Solution   Arranging the data in an ascending order, we get the given data as
          1, 1, 1, 1, 1,2,2,2,2,2,2,2,3,3,3,3,3,3,4,4.        What is the total frequency?
       For counting purposes, we use tally marks. After putting 4 tally marks vertically, we put a       3. In the given frequency table, the frequency of temperatures during a month is given.3. In the given
       cross as shown below and again we take the tally marks in the same manner, counting in sets           frequency table, the frequency of temperatures during a month is given.
       of fives.        Draw the tally marks.
       Now, we may prepare the frequency table, as shown below.  Temperature        Number
 No. of families                 in °C                  Tally marks                 of days
 Observation  Tally marks
 (Frequency)
                                  32                                                   4
 1  | | | |  5
                                  34                                                   7
 2  | | | |  | |  7
                                  36                                                   10
 3  | | | |  |  6
                                  38                                                   6
 4  | |  2
                                  40                                                   3