Page 198 - classs 6 a_Neat
P. 198

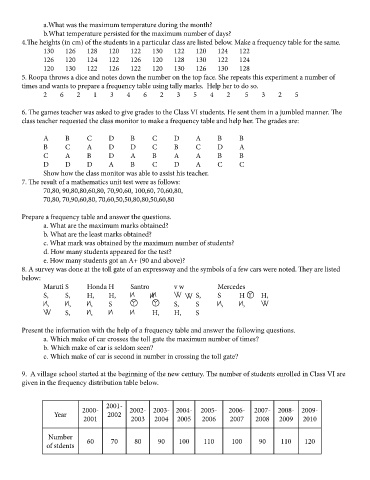
a.What was the maximum temperature during the month?                                                                              a. In which year were the maximum number of students enrolled?
               b.What temperature persisted for the maximum number of days?                                                                      b. In which two academic years were the same number of students enrolled?
        4.The heights (in cm) of the students in a particular class are listed below. Make a frequency table for the same.         10.           The following frequency table gives the number of hours spent per week by
               130     126    128    120    122    130     122    120    124    122                                                              children in playing sports.
               126     120    124    122    126    120     128    130    122    124
               120     130    122    126    122    120     130    126    130    128                                                                  Number of             Tally marks            Frequency
        5. Roopa throws a dice and notes down the number on the top face. She repeats this experiment a number of                                       hours
        times and wants to prepare a frequency table using tally marks.  Help her to do so.                                                              12                     | | |                  3
               2        6        2        1        3        4        6        2        3        5        4        2         5        3        2        5
                                                                                                                                                         13                  | | | |   | |             7
        6. The games teacher was asked to give grades to the Class VI students. He sent them in a jumbled manner. The
        class teacher requested the class monitor to make a frequency table and help her. The grades are:                                                14                  | | | |   | | |           8
                                                                                                                                                         15                 | | | |   | | | |         10
               A       B      C      D      B      C       D      A      B      B
               B       C      A      D      D      C       B      C      D      A                                                                        16                 | | | |   | | | |          9
               C       A      B      D      A      B       A      A      B      B
               D       D      D      A      B      C       D      A      C      C                                                                        17                   | | | |   |              6
               Show how the class monitor was able to assist his teacher.
        7. The result of a mathematics unit test were as follows:                                                                                        18                     | |                    2
               70,80, 90,80,80,60,80, 70,90,60, 100,60, 70,60,80,
               70,80, 70,90,60,80, 70,60,50,50,80,80,50,60,80
                                                                                                                                                 a. What is the maximum number of hours spent per week on sports?
        Prepare a frequency table and answer the questions.                                                                                      b. What is the minimum number of hours spent per week on sports?
               a. What are the maximum marks obtained?                                                                                           c. How many students spend less than 15 hours per week on sports?
               b. What are the least marks obtained?
               c. What mark was obtained by the maximum number of students?                                                        PICTOGRAPH
               d. How many students appeared for the test?
               e. How many students got an A+ (90 and above)?                                                                      EXAMPLE:             Mr Brown has an ice cream parlour. The sale of ice cream per day is repre sented
        8. A survey was done at the toll gate of an expressway and the symbols of a few cars were noted. They are listed                                weekly on a
        below:                                                                                                                                          colourful board. The ice cream cone represents the sale.
               Maruti S       Honda H       Santro         v w           Mercedes                                                                         Monday
               S,      S,     H,     H,                           S,     S      H      H,
                 ,      ,      ,     S                     S,     S       ,       ,                                                                       Tuesday
                       S,      ,                   H,      H,     S

        Present the information with the help of a frequency table and answer the following questions.                                                    Wednesday
               a. Which make of car crosses the toll gate the maximum number of times?
               b. Which make of car is seldom seen?                                                                                                       Thursday
               c. Which make of car is second in number in crossing the toll gate?
                                                                                                                                                          Friday

        9.  A village school started at the beginning of the new century. The number of students enrolled in Class VI are
        given in the frequency distribution table below.                                                                                                  Saturday

                                                                                                                                                          Sunday
                                    2001-
                            2000-           2002- 2003- 2004-      2005-     2006-   2007- 2008- 2009-
                   Year              2002
                             2001           2003    2004    2005    2006     2007     2008   2009    2010

                 Number                                                                                                                                                  One  represents sale of 10 ice creams
                of stdents    60      70     80      90     100     110       100      90     110     120
   193   194   195   196   197   198   199   200   201   202   203