
Page 201 - classs 6 a_Neat
P. 201
1. On which day of the week did Mr Brown sell the maximum ice creams? Draw a pictograph.
2. On which day of the week did Mr Brown sell the least number of ice creams? SOLUTION Let us choose the scale as given below:
Pictograph = 10 students (walking)
An information regarding the number of certain things can be nicely conveyed through pictures. PICTOGRAPH = 10 students (using bicycles)
The representation of an information through pictures is called a pictograph. = 10 students (using car)
q = 10 students (using car)
ILLUSTRATIVE EXAMPLES Now we may draw the pictograph as shown below.
EXAMPIE: 1 The number of cricket bats sold by a shop during a week are given below. Mode Number of students
Day Monday Tuesday Wednesday Thursday Friday Saturday Walking
No. of 20 12 24 32 8 16 Using bicycles
bats sold
Using Cars
Draw a pictograph.
Using Bus
SOLUTION Scale, = 4 bats sold
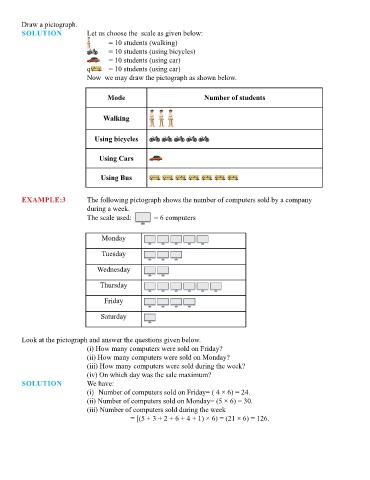
EXAMPLE:3 The following pictograph shows the number of computers sold by a company
Now, we may draw the pictograph, as shown below. during a week.
The scale used: = 6 computers
Day No. of bats sold
Monday
Monday Tuesday
Tuesday Wednesday
Thursday
Wednesday
Friday
Thursday Saturday
Friday Look at the pictograph and answer the questions given below.
(i) How many computers were sold on Friday?
Saturday (ii) How many computers were sold on Monday?
(iii) How many computers were sold during the week?
(iv) On which day was the sale maximum?
SOLUTION We have:
EXAMPLE: 2 The modes of travelling to school by 160 students are given below: (i} Number of computers sold on Friday= ( 4 × 6) = 24.
(ii) Number of computers sold on Monday= (5 × 6) = 30.
(iii) Number of computers sold during the week
Mode = [(5 + 3 + 2 + 6 + 4 + 1) × 6) = (21 × 6) = 126.
By Walking On Bicycle By Car By Bus
No. of stdents 30 50 10 70