Page 204 - classs 6 a_Neat
P. 204

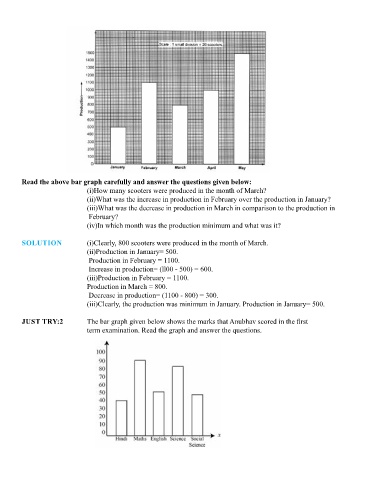
1.     In which subject did Anubhav score the minimum marks?
                                                                                                                                   2.     In which two subjects did Anubhav score the same marks?
                                                                                                                                   3.     In which subject did Anubhav score the maximum marks?
                                                                                                                                   4.     How many marks did Anubhav score in science?
                                                                                                                                   5.     What is the difference between his marks in Hindi and in mathematics?


                                                                                                                                   JUST TRY:3  A shoe company does a survey to find the shoe size that is most commonly used

                                                                                                                                                  Size              4        5         6         7         8        9        10

                                                                                                                                                  Number of
                                                                                                                                                  students         100      250       400       600      300       150       50


                                                                                                                                                 Depict the information on a bar graph.


                                                                                                                                                                              EXERCISE 15-B


                                                                                                                                   1.     The pictograph given below shows how many letters were collected from a post
        Read the above bar graph carefully and answer the questions given below:                                                          box on each day of a certain week.
                              (i)How many scooters were produced in the month of March?
                              (ii)What was the increase in production in February over the production in January?                               Monday
                              (iii)What was the decrease in production in March in comparison to the production in
                              February?                                                                                                         Tuesday
                              (iv)In which month was the production minimum and what was it?
                                                                                                                                              Wednesday
        SOLUTION              (i)Clearly, 800 scooters were produced in the month of March.
                              (ii)Production in January= 500.                                                                                  Thursday
                               Production in February = 1100.
                               Increase in production= (ll00 - 500) = 600.                                                                      Friday
                              (iii)Production in February = 1100.
                               Production in March = 800.                                                                                      Saturday
                               Decrease in production= (1100 - 800) = 300.
                              (iii)Clearly, the production was minimum in January. Production in January= 500.
                                                                                                                                                                   One        represents 1 0 letters
        JUST TRY:2            The bar graph given below shows the marks that Anubhav scored in the first
                              term examination. Read the graph and answer the questions.                                           From the pictograph, answer the following questions.
                                                                                                                                                 a. On which day were the minimum number of letters collected?
                                                                                                                                                 b. How many more letters were collected on Thursday than on Wednesday?
                                                                                                                                                 c. How many fewer letters were collected on Friday than on Tuesday?
                                                                                                                                                 d. On which day were the maximum number of letters collected?
                                                                                                                                                 e. What was the total number of letters collected over the week?


                                                                                                                                   2.     The pictograph given below shows how many trees were planted by schools during
                                                                                                                                          a tree plantation drive.
   199   200   201   202   203   204   205   206   207   208   209