
Page 207 - classs 6 a_Neat
P. 207
School Number of trees Use the symbol to represent 50 students. Represent the information on a pictograph.
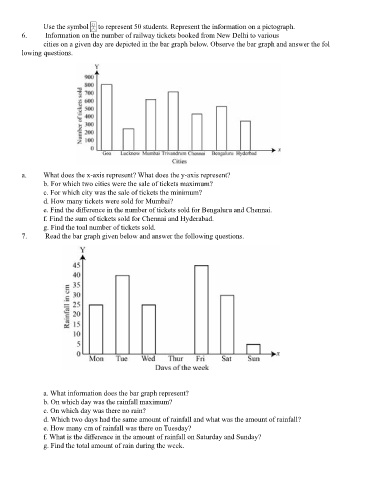
6. Information on the number of railway tickets booked from New Delhi to various
A cities on a given day are depicted in the bar graph below. Observe the bar graph and answer the fol
lowing questions.
B
C
D
M
P
One represents 5 trees
From the pictograph, answer the following questions. a. What does the x-axis represent? What does the y-axis represent?
a. Which school planted the maximum number of trees? How many trees did they plant? b. For which two cities were the sale of tickets maximum?
b. Which school planted the least number of trees? c. For which city was the sale of tickets the minimum?
c. Which two schools planted the same number of trees? d. How many tickets were sold for Mumbai?
d. What is the difference in the number of trees planted by school C and school P? e. Find the difference in the number of tickets sold for Bengaluru and Chennai.
e. Planet earth is richer by how many trees after their tree planting campaign? f. Find the sum of tickets sold for Chennai and Hyderabad.
3. The following table shows the number of ‘i 1 O’ Santro cars sold in the first six g. Find the toal number of tickets sold.
months of 2010. Represent this information through a pictograph. Use the symbol i10 to 7. Read the bar graph given below and answer the following questions.
represent 10 cars.
Jan Feb Mar Apr May June
300 400 200 500 600 400
4. A school offers training in several sports to its students. A tabular representation
of the games and the students who opt for them is given below. Represent the information as
a pictograph.
Use the symbol to represent 25 students.
Cricket Football Tennis Basketball Volleyball Hockey
225 200 150 100 50 75
5. The number of students enrolled in the primary section of a school in the last
decade are as follows:
a. What information does the bar graph represent?
2000- 2001- 2002- 2003- 2004- 2005- 2006- 2007- 2008- 2009- b. On which day was the rainfall maximum?
2001 2002 2003 2004 2005 2006 2007 2008 2009 2010 c. On which day was there no rain?
200 300 400 450 600 500 650 550 600 750 d. Which two days had the same amount of rainfall and what was the amount of rainfall?
e. How many cm of rainfall was there on Tuesday?
f. What is the difference in the amount of rainfall on Saturday and Sunday?
g. Find the total amount of rain during the week.