
Page 203 - classs 6 a_Neat
P. 203
(iv) Clearly, the sale was maximum on Thursday. Read the bar graph carefully and answer the questions given below:
JUST TRY:1 Mr Brown has an ice cream parlour. The sale of ice cream per day is repre (i) In which subject does Tarun get the lowest marks?
sented weekly on a colourful board. The ice cream cone represents the sale. (ii) In which subject does Tarun get the highest marks?
Monday (iii) How many marks does he get in English?
(iv) In which subjects does Tarun get less than 50 marks?
Tuesday SOLUTION It is clear from the bar graph that:
(i) Tarun gets the lowest marks in Social studies.
Wednesday (ii) Tarun gets the highest marks in Mathematics.
(iii) Tarun gets 52 marks in English.
Thursday (iv) Tarun gets less than 50 marks in each of the subjects Hindi, Science and
Social studies.
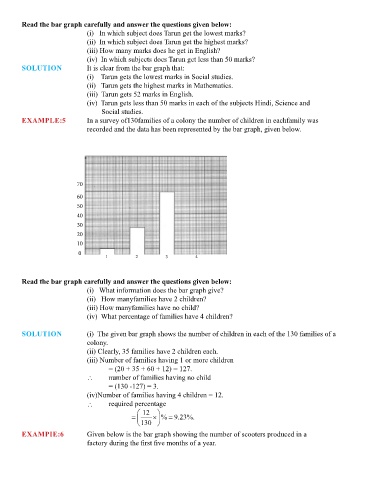
Friday EXAMPLE:5 In a survey of130families of a colony the number of children in eachfamily was
recorded and the data has been represented by the bar graph, given below.
Saturday
Sunday
70
One represents sale of 10 ice creams
60
50
1. On which day of the week did Mr Brown sell the maximum ice creams? 40
2. On which day of the week did Mr Brown sell the least number of ice creams? 30
20
BAR GRAPH (OR COLUMN GRAPH) A bar graph is a pictorial representation of numerical data 10
in the form of rectangles (or bars) of equal width and varying heights. 0
1 2 3 4
READING AND INT ERPRETATION OF A BAR GRAPH
From a given bar graph we may answer various questions based on it, as shown below. Read the bar graph carefully and answer the questions given below:
(i) What information does the bar graph give?
EXAMPLE:4 Given below is a bar graph showing the marks obtained by Tarun in five subjects (ii) How manyfamilies have 2 children?
in an annual examination. (iii) How manyfamilies have no child?
(iv) What percentage of families have 4 children?
Marks obtained by Tarun in an annual examination
SOLUTION (i) The given bar graph shows the number of children in each of the 130 families of a
70 colony.
(ii) Clearly, 35 families have 2 children each.
60
(iii) Number of families having 1 or more children
50 = (20 + 35 + 60 + 12) = 127.
40 ∴ number of families having no child
= (130 -127) = 3.
30
(iv)Number of families having 4 children = 12.
20 ∴ required percentage
10 12
=
= × % 9.23%.
0 130
Hindi English Maths. Science S. studies
EXAMPIE:6 Given below is the bar graph showing the number of scooters produced in a
Subjects→ factory during the first five months of a year.