
Page 66 - M97TB9_2018-19_[low-res]_F2F_Neat2
P. 66
3/8 M97/February 2018 Reinsurance
Example 3.3
A food processing plant is valued at £50m. The insurer seeks facultative excess of loss reinsurance broken down
into three layers:
1st layer £9.5m excess of £500,000.
2nd layer £20m excess of £10m.
3rd layer £20m excess of £30m.
Reinsurers participating on the third layer are liable for an amount equivalent to 40% of the total value (£20m part of
£50m). However, they cannot be exposed to a loss unless it exceeds £30m.
3 Experience tells us that there is a considerable difference in relationship between the total number of claims (the
Chapter frequency of loss) and the size of claims that occur (the severity of loss).
Although the example provides a monetary limit equal to 40% of the total value of the risk, it is unlikely
that the actual claims experience affecting this layer will be 40% of the total claims experience. Only
rarely will a loss occur that gives rise to a claim at this level. This reaffirms the belief that primary
placements are much more likely to be affected by claims, adding to the probability of loss calculations
that the reinsurance underwriter must factor in when costing the provision of cover at lower levels of the
programme.
Research shows that the reinsurer’s claims experience on any one risk decreases significantly as the
Reinsurers of the top
layers of the excess or deductible retained by the reinsured increases. Consequently, the amount of the original
programme will be premium to be paid to excess of loss reinsurers relative to the risk they undertake reduces as the excess
less exposed to a loss
or deductible increases and according to whether any lower layers exist beneath them. Reinsurers of the
top layers of the programme will be less exposed to a loss and, therefore, should expect to receive a
lower premium than those on the bottom layers. We can say that the relationship between the insurer’s
deductible and that part of the total original premium required by the reinsurer is inverse.
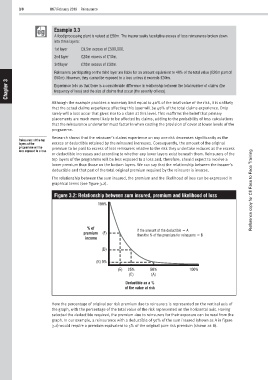
The relationship between the sum insured, the premium and the likelihood of loss can be expressed in
graphical terms (see figure 3.2).
Figure 3.2: Relationship between sum insured, premium and likelihood of loss Reference copy for CII Face to Face Training
100%
% of
premium (F) If the amount of the deductible = A
then the % of the premium for reinsurers = B
income
(D)
(B) 5%
(E) 25% 50% 100%
(C) (A)
Deductible as a %
of the value at risk
Here the percentage of original per risk premium due to reinsurers is represented on the vertical axis of
the graph, with the percentage of the total value of the risk represented on the horizontal axis. Having
selected the deductible required, the premium due to reinsurers for their exposure can be read from the
graph. In our example, a reinsurance with a deductible of 50% of the sum insured (shown as A in figure
3.2) would require a premium equivalent to 5% of the original pure risk premium (shown as B).