
Page 2 - Test
P. 2
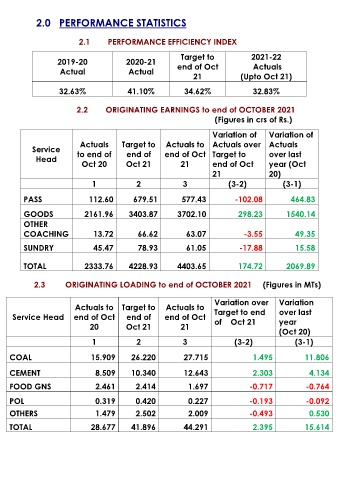
2.0   PERFORMANCE STATISTICS


                              2.1        PERFORMANCE EFFICIENCY INDEX

                                                                 Target to               2021-22
                     2019-20                 2020-21                                      Actuals
                                                               end of Oct
                      Actual                  Actual
                                                                     21               (Upto Oct 21)

                      32.63%                  41.10%              34.62%                  32.83%

                             2.2        ORIGINATING EARNINGS to end of OCTOBER 2021
                                                                                                 (Figures in crs of Rs.)

                                                                            Variation of       Variation of
                             Actuals        Target to      Actuals to  Actuals over  Actuals
            Service

              Head          to end of        end of        end of Oct  Target to               over last
                              Oct 20         Oct 21             21          end of Oct         year (Oct
                                                                            21                 20)
                                 1               2               3               (3-2)              (3-1)

         PASS                   112.60          679.51           577.43            -102.08             464.83


         GOODS                 2161.96        3403.87          3702.10               298.23           1540.14
         OTHER
         COACHING                 13.72          66.62            63.07                -3.55             49.35

                                  45.47
                                                                  61.05
                                                 78.93
                                                                                     -17.88
         SUNDRY                  HYDERABAAD DIVISION                                                     15.58
         TOTAL                 2333.76        4228.93          4403.65               174.72           2069.89

               2.3         ORIGINATING LOADING to end of OCTOBER 2021     (Figures in MTs)


                                                                            Variation over         Variation
                           Actuals to  Target to           Actuals to
     Service Head  end of Oct                end of        end of Oct       Target to end          over last
                                                                            of    Oct 21
                                                                                                   year
                                 20          Oct 21             21
                                                                                                   (Oct 20)
                                 1               2               3                 (3-2)                 (3-1)

    COAL                         15.909        26.220             27.715                  1.495             11.806

    CEMENT                         8.509       10.340             12.643                  2.303               4.134

    FOOD GNS                       2.461         2.414             1.697                 -0.717             -0.764


    POL                            0.319         0.420             0.227                 -0.193             -0.092
    OTHERS                         1.479         2.502             2.009                 -0.493               0.530

    TOTAL                        28.677        41.896             44.291                  2.395             15.614