
Page 7 - P S - Mech Power
P. 7
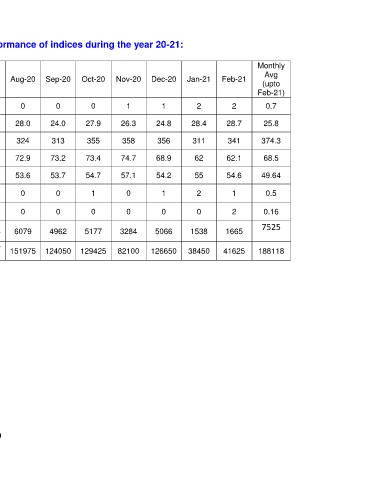
Performance details of diesel traction: Performance of indices during the year 20-21:


                                                                                      Monthly
 Monthly
 Item   Avg,   Target   Apr-20   May-20   Jun-20   Jul-20   Aug-20  Sep-20   Oct-20   Nov-20   Dec-20   Jan-21   Feb-21   Avg
 (2019-20)                                                                              (upto
                                                                                      Feb-21)

 OL loco Failures   4.4   ***   0   1   0   1   0   0   0   1   1   2         2          0.7

 Outage   19.1   15.0   19.2   18.3   26.5   31.3   28.0   24.0   27.9   26.3   24.8   28.4   28.7   25.8


 Utilization   412.7   571   454   395   458   452   324   313   355   358   356   311   341   374.3


 9 Hours   56.7   85%   64.3   51.8   72.9   77.4   72.9   73.2   73.4   74.7   68.9   62   62.1   68.5

 Speed   18.66   50   32.6   38   39   53.5   53.6   53.7   54.7   57.1   54.2   55   54.6   49.64

 Punctuality loss
 direct   4.6   -   0   0   0   0   0   0   1   0      1          2           1          0.5
 Punctuality loss in-  5.5   -   0   0   0   0   0   0   0   0   0   0        2         0.16
 direct
 Fuel Economy   5707   -   19386   12874   12197   10544   6079   4962   5177   3284   5066   1538   1665   7525
 (Shutdown Hours)
 26360
 Fuel oil saved Ltrs.   142674   -   484650  321850  304925   151975  124050  129425   82100   126650   38450   41625   188118
 0


 159