
Page 25 - Oxford West Investor Quarterly Report 1.25.22
P. 25
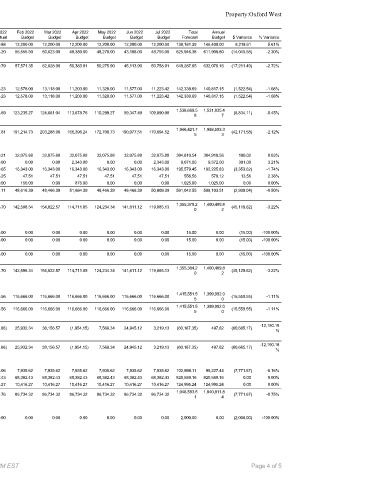
Forecasted Income Statement                                                Property:Oxford West


 Aug 2021  Sep 2021  Oct 2021  Nov 2021  Dec 2021  Jan 2022  Feb 2022  Mar 2022  Apr 2022  May 2022  Jun 2022  Jul 2022  Total  Annual
 Account  Account Name  Actual  Actual  Actual  Actual  Actual  Actual  Budget  Budget  Budget  Budget  Budget  Budget  Forecast  Budget  $ Variance  % Variance
 6465  Internet Service  12,210.88  12,210.88  6,376.83  11,791.87  10,180.05  12,210.88  12,200.00  12,200.00  12,200.00  12,200.00  12,200.00  12,200.00  138,181.39  146,400.00  8,218.61  5.61%
 Total Unit Utilities  49,010.49  47,958.86  43,438.39  43,493.04  64,855.90  72,498.20  55,555.50  60,623.00  48,380.00  48,270.00  43,108.00  48,755.00  625,946.38  611,900.80  (14,045.58)  -2.30%

 Total Utilities  50,866.09  49,734.50  44,912.21  45,041.47  66,690.72  75,309.79  57,571.35  62,628.90  50,383.91  50,275.90  45,113.90  50,758.91  649,287.65  632,076.16  (17,211.49)  -2.72%

 Management Fees
 6320  Management Fee  13,597.42  11,266.25  11,099.39  11,262.58  11,269.40  12,825.23  12,578.00  13,118.00  11,203.00  11,320.00  11,577.00  11,223.42  142,339.69  140,817.15  (1,522.54)  -1.08%
 Total Management Fees  13,597.42  11,266.25  11,099.39  11,262.58  11,269.40  12,825.23  12,578.00  13,118.00  11,203.00  11,320.00  11,577.00  11,223.42  142,339.69  140,817.15  (1,522.54)  -1.08%

                                                           1,538,669.5  1,531,835.4
 Total Controllable Expenses  276,309.62  121,120.42  101,245.59  101,457.08  113,360.37  144,063.69  123,235.27  124,661.04  113,678.76  110,299.27  99,347.49  109,890.98  (6,834.11)  -0.45%
                                                                 8        7
                                                           1,946,421.7  1,988,593.3
 Controllable Cash Flow  (2,946.22)  169,043.74  190,412.37  174,557.10  190,474.26  130,507.81  191,214.73  203,288.96  166,396.24  172,700.73  190,077.51  170,694.52  (42,171.58)  -2.12%
                                                                 5        3
 Taxes & Insurance
 6710  Property Taxes  32,059.21  32,059.21  32,059.21  32,059.21  32,059.21  32,059.21  32,075.88  32,075.88  32,075.88  32,075.88  32,075.88  32,075.88  384,810.54  384,910.56  100.02  0.03%
 6715  Other Taxes  0.00  0.00  2,119.00  0.00  0.00  2,266.00  0.00  0.00  2,343.00  0.00  0.00  2,343.00  9,071.00  9,372.00  301.00  3.21%
 6720  Property Insurance  16,788.32  16,080.36  16,080.36  16,080.36  16,081.40  16,410.65  16,343.00  16,343.00  16,343.00  16,343.00  16,343.00  16,343.00  195,579.45  192,225.83  (3,353.62)  -1.74%
 6721  Other Insurance  45.25  45.25  45.25  45.25  45.25  45.25  47.51  47.51  47.51  47.51  47.51  47.51  556.56  570.12  13.56  2.38%
 6750  Property Tax Consultant  0.00  0.00  0.00  0.00  0.00  0.00  150.00  0.00  875.00  0.00  0.00  0.00  1,025.00  1,025.00  0.00  0.00%
 Total Taxes & Insurance  48,892.78  48,184.82  50,303.82  48,184.82  48,185.86  50,781.11  48,616.39  48,466.39  51,684.39  48,466.39  48,466.39  50,809.39  591,042.55  588,103.51  (2,939.04)  -0.50%

                                                           1,355,379.2  1,400,489.8
 Net Operating Income  (51,839.00)  120,858.92  140,108.55  126,372.28  142,288.40  79,726.70  142,598.34  154,822.57  114,711.85  124,234.34  141,611.12  119,885.13  (45,110.62)  -3.22%
                                                                 0        2
 Other Finance Related
 6899  Other Financial Expense  0.00  0.00  5.00  0.00  5.00  5.00  0.00  0.00  0.00  0.00  0.00  0.00  15.00  0.00  (15.00)  -100.00%
 Total Other Finance Related  0.00  0.00  5.00  0.00  5.00  5.00  0.00  0.00  0.00  0.00  0.00  0.00  15.00  0.00  (15.00)  -100.00%

 Total Non-Controllable Expenses  0.00  0.00  5.00  0.00  5.00  5.00  0.00  0.00  0.00  0.00  0.00  0.00  15.00  0.00  (15.00)  -100.00%

                                                           1,355,364.2  1,400,489.8
 Cash Flow Before Debt Service  (51,839.00)  120,858.92  140,103.55  126,372.28  142,283.40  79,721.70  142,598.34  154,822.57  114,711.85  124,234.34  141,611.12  119,885.13  (45,125.62)  -3.22%
                                                                 0        2
 Debt Service
                                                           1,415,551.5  1,399,992.0
 6820  Interest Expense  120,555.55  120,555.56  116,666.66  120,555.56  116,666.66  120,555.56  116,666.00  116,666.00  116,666.00  116,666.00  116,666.00  116,666.00  (15,559.55)  -1.11%
                                                                 5        0
                                                           1,415,551.5  1,399,992.0
 Total Debt Service  120,555.55  120,555.56  116,666.66  120,555.56  116,666.66  120,555.56  116,666.00  116,666.00  116,666.00  116,666.00  116,666.00  116,666.00  (15,559.55)  -1.11%
                                                                 5        0
 (172,394.55                                                                           -12,190.18
 Cash Flow After Debt Service  303.36  23,436.89  5,816.72  25,616.74  (40,833.86)  25,932.34  38,156.57  (1,954.15)  7,568.34  24,945.12  3,219.13  (60,187.35)  497.82  (60,685.17)
 )                                                                                          %
 (172,394.55                                                                           -12,190.18
 Cash Flow Before Deprec/Amort  303.36  23,436.89  5,816.72  25,616.74  (40,833.86)  25,932.34  38,156.57  (1,954.15)  7,568.34  24,945.12  3,219.13  (60,187.35)  497.82  (60,685.17)
 )                                                                                          %
 Depreciation/Amortization
 8000  Depreciation - FF&E  8,583.44  9,316.12  9,341.50  9,341.50  9,396.77  9,406.06  7,935.62  7,935.62  7,935.62  7,935.62  7,935.62  7,935.62  102,999.11  95,227.44  (7,771.67)  -8.16%
 8005  Deprec Expense-Building  68,382.43  68,382.43  68,382.43  68,382.43  68,382.43  68,382.43  68,382.43  68,382.43  68,382.43  68,382.43  68,382.43  68,382.43  820,589.16  820,589.16  0.00  0.00%
 8006  Amortization-Loan Fees  10,416.27  10,416.27  10,416.27  10,416.27  10,416.27  10,416.27  10,416.27  10,416.27  10,416.27  10,416.27  10,416.27  10,416.27  124,995.24  124,995.24  0.00  0.00%
                                                           1,048,583.5  1,040,811.8
 Total Depreciation/Amortization  87,382.14  88,114.82  88,140.20  88,140.20  88,195.47  88,204.76  86,734.32  86,734.32  86,734.32  86,734.32  86,734.32  86,734.32  (7,771.67)  -0.75%
                                                                 1        4
 Other Expenses
 8515  Other Professional Fees  0.00  0.00  0.00  0.00  0.00  2,000.00  0.00  0.00  0.00  0.00  0.00  0.00  2,000.00  0.00  (2,000.00)  -100.00%


 Forecasted Income Statement 1.6 generated 02/18/2022 03:23 PM EST and data as of 02/18/2022 03:23 PM EST  Page 4 of 5