
Page 57 - BLENDED LEARNING
P. 57
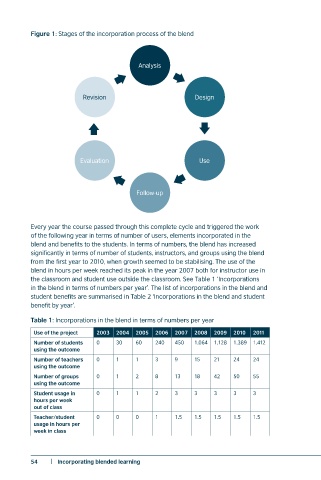
Figure 1: Stages of the incorporation process of the blend


                                       Analysis


                        Revision                       Design


                       Evaluation                       Use


                                       Follow-up


          Every year the course passed through this complete cycle and triggered the work
          of the following year in terms of number of users, elements incorporated in the
          blend and benefits to the students. In terms of numbers, the blend has increased
          significantly in terms of number of students, instructors, and groups using the blend
          from the first year to 2010, when growth seemed to be stabilising. The use of the
          blend in hours per week reached its peak in the year 2007 both for instructor use in
          the classroom and student use outside the classroom. See Table 1 ‘Incorporations
          in the blend in terms of numbers per year’. The list of incorporations in the blend and
          student benefits are summarised in Table 2 ‘Incorporations in the blend and student
          benefit by year’.
          Table 1: Incorporations in the blend in terms of numbers per year

          Use of the project   2003  2004  2005  2006  2007  2008  2009  2010  2011
          Number of students   0  30  60    240  450   1,064  1,128  1,389  1,412
          using the outcome
          Number of teachers   0  1   1     3    9     15   21   24    24
          using the outcome
          Number of groups   0   1    2     8    13    18   42   50    55
          using the outcome
          Student usage in   0   1    1     2    3     3    3    3     3
          hours per week
          out of class
          Teacher/student   0    0    0     1    1.5   1.5  1.5  1.5   1.5
          usage in hours per
          week in class


          54   |  Incorporating blended learning