Page 9 - Summer 2014
P. 9
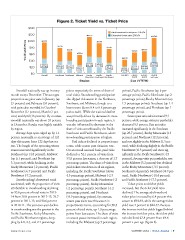
Figure 2. Ticket Yield vs. Ticket Price $140 Adult weekend ticket price 2013/14 $120 $93.33 $110.22 $91.39 Estimated ticket yield 2013/14 $107.46 $100 Yield and Price $80 $77.14 $66.15 $55.34 $73.61 $63.26 $66.83 $60 $40 $51.00 $48.82 $40.78 $49.99 $44.57 (46.3%) $37.81 $36.50 $20 (47.8%) (47.3%) (57.2%) $24.32 (53.4%) $31.30 $32.61 (52.4%) (46.5%) $35.04 $19.84 (44%) (42.5%) (48.7%) (51.6%) $0 Overall Northeast Southeast Midwest Rocky Pacific Pacific 0–2,999 3,000– 6,000– 12,000 Mountain Southwest Northwest 5,999 11,999 and over Region Size (VTF/H) Snowfall nationally was up in every points respectively (in terms of share of points), Pacific Southwest (up 3 per- month except December. The strongest total visits). Snowboarding participation centage points), Pacific Northwest (up 2 proportionate gains were in January (up also dipped this season in the Northeast, percentage points), Rocky Mountain (up 27 percent) and February (34 percent), Southeast, and Midwest, though to a 1.5 percentage points), Southeast (up 1.4 with gains also recorded in October/ lesser extent (down 0.4 to 0.8 percentage percentage points), and Northeast (up 1 November (17 percent), March (7 per- points each). While the national decline percentage point). cent) and April (16 percent). By contrast, was primarily driven by decreases in snow- Season pass unit sales increased 9.5 snowfall nationally was down 35 percent boarding participation in each region, it percent, while average visits per passholder in December. Results were highly variable was also influenced by decreases in the decreased 5.3 percent. Pass unit sales by region. share of visits contributed by the Pacific increased significantly in the Southeast Average days open edged up by 1.1 Southwest and Pacific Northwest, where (up 28.7 percent), Rocky Mountains (14 percent nationally, to an average of 124 snowboarding participation is highest. percent), and Northeast (12.2 percent), days this season from 122 days last sea- Paid tickets declined in proportionate and rose slightly in the Midwest (1.5 per- son. The length of the operating winter terms, while season pass visitation rose. cent), while declining slightly in the Pacific season increased significantly in the On an overall national basis, paid visits Northwest (-0.3 percent) and more sig- Southeast (up 14.8 percent), Midwest declined to 52.1 percent of visits from nificantly in the Pacific Southwest (-4.9 (up 6.1 percent), and Northeast (up 53.8 percent last season, a decrease of 1.7 percent). Average visits per passholder rose 3.1 percent), while declining in the percentage points. The share of visits from in the Midwest (5.2 percent) but declined Rocky Mountains (-2 percent), Pacific paid tickets was down in all six regions, in the Rocky Mountains (-3.5 percent), Southwest (-6.7 percent) and Pacific including the Pacific Southwest (down Southeast (-4 percent), Northeast (-8.9 per- Northwest (-7.2 percent). 4.5 percentage points), Midwest (-2.3 cent), Pacific Northwest (-10.4 percent), Snowboarding’s downward trend percentage points), Pacific Northwest (-2 and Pacific Southwest (-17.3 percent). accelerated, with the proportion of visits percentage points), Rocky Mountains Ticket prices and ticket yields attributable to snowboarding declining (-2 percentage points), Southeast (-1.2 increased, but the ticket yield ratio to 26.6 percent of total visits in 2013- percentage points), and Northeast declined. The average adult weekend 14 from 28.9 percent in 2012-13, 29.7 (-0.9 percentage points). By contrast, ticket price increased by 6.4 percent this percent in 2011-12, and 30.6 percent season pass visits rose this season in season to $93.33, while the average ticket in 2010-11. The year-over-year decline proportionate terms, accounting for 38.3 yield rose 2 percent to $44.57. Because in snowboarding was the greatest in the percent of total visits, up 1.3 percentage the increase in ticket yields lagged behind Pacific Southwest, Rocky Mountain, points from last season. The share of visits the increase in ticket price, the ticket yield and Pacific Northwest regions, drop- on season passes increased in each region, ratio declined 47.8 percent from 49.8 ping by 4.8, 2.3, and 2.1 percentage including the Midwest (up 3 percentage percent a year ago (figure 2). w w w. n s a a . o rg SUMMER 2014 | NSAA Journal | 7 NSAA Summer 2014 prepressed v6a.indd 7 7/3/14 4:18 PM