
Page 59 - Quality control of pharmaceuticals (07-PA 704)
P. 59
Slope of least square line: b = ∑ {( − ̅)( − ̅ )}
∑ ( − ̅)2
Intercept of least squares line: a= ̅ –b ̅
Errors in the slope and intercept of the regression line. The regression line will in
practice by used to estimate the concentration of test materials by interpolation.
The random errors in the values for the slope and intercept are thus of importance.
The statistic ⁄ , which estimates the random errors in the y-direction:
⁄ = √∑ ( − ̅ )2
−2
By using this value, we can calculate Sb and Sa the standard deviation for the slope
(b) and the intercept (a), respectably
Standard deviation of slope: Sb = ⁄
√∑ ( − ̅)2
Standard deviation of intercept: Sa = ⁄ √ ∑ 2
∑ ( − ̅)2
Acceptance criteria:
Acceptance criteria provided by various researchers:
• The correlation coefficient will be > 0.99
• The y-intercept will be < 2% of the target concentration.
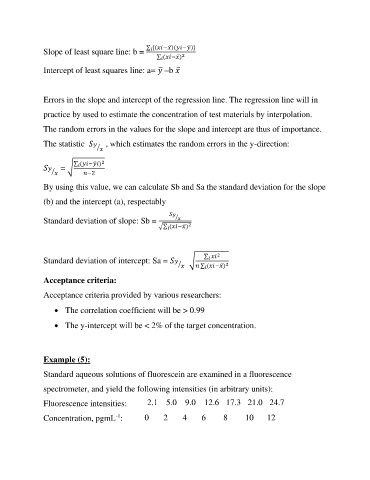
Example (5):
Standard aqueous solutions of fluorescein are examined in a fluorescence
spectrometer, and yield the following intensities (in arbitrary units):
Fluorescence intensities: 2.1 5.0 9.0 12.6 17.3 21.0 24.7
Concentration, pgmL-1: 0 2 4 6 8 10 12