
Page 198 - Applied Pharmacognosy
P. 198
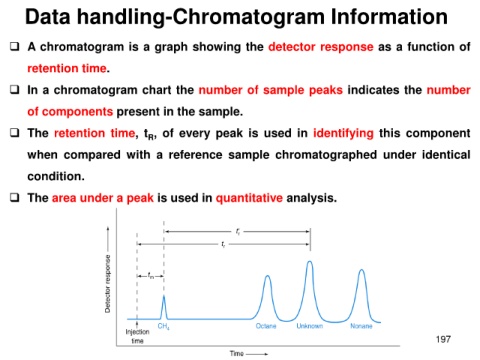
Data handling-Chromatogram Information

❑ A chromatogram is a graph showing the detector response as a function of
    retention time.

❑ In a chromatogram chart the number of sample peaks indicates the number
    of components present in the sample.

❑ The retention time, tR, of every peak is used in identifying this component
    when compared with a reference sample chromatographed under identical
    condition.

❑ The area under a peak is used in quantitative analysis.

                                                                                                                                          197